


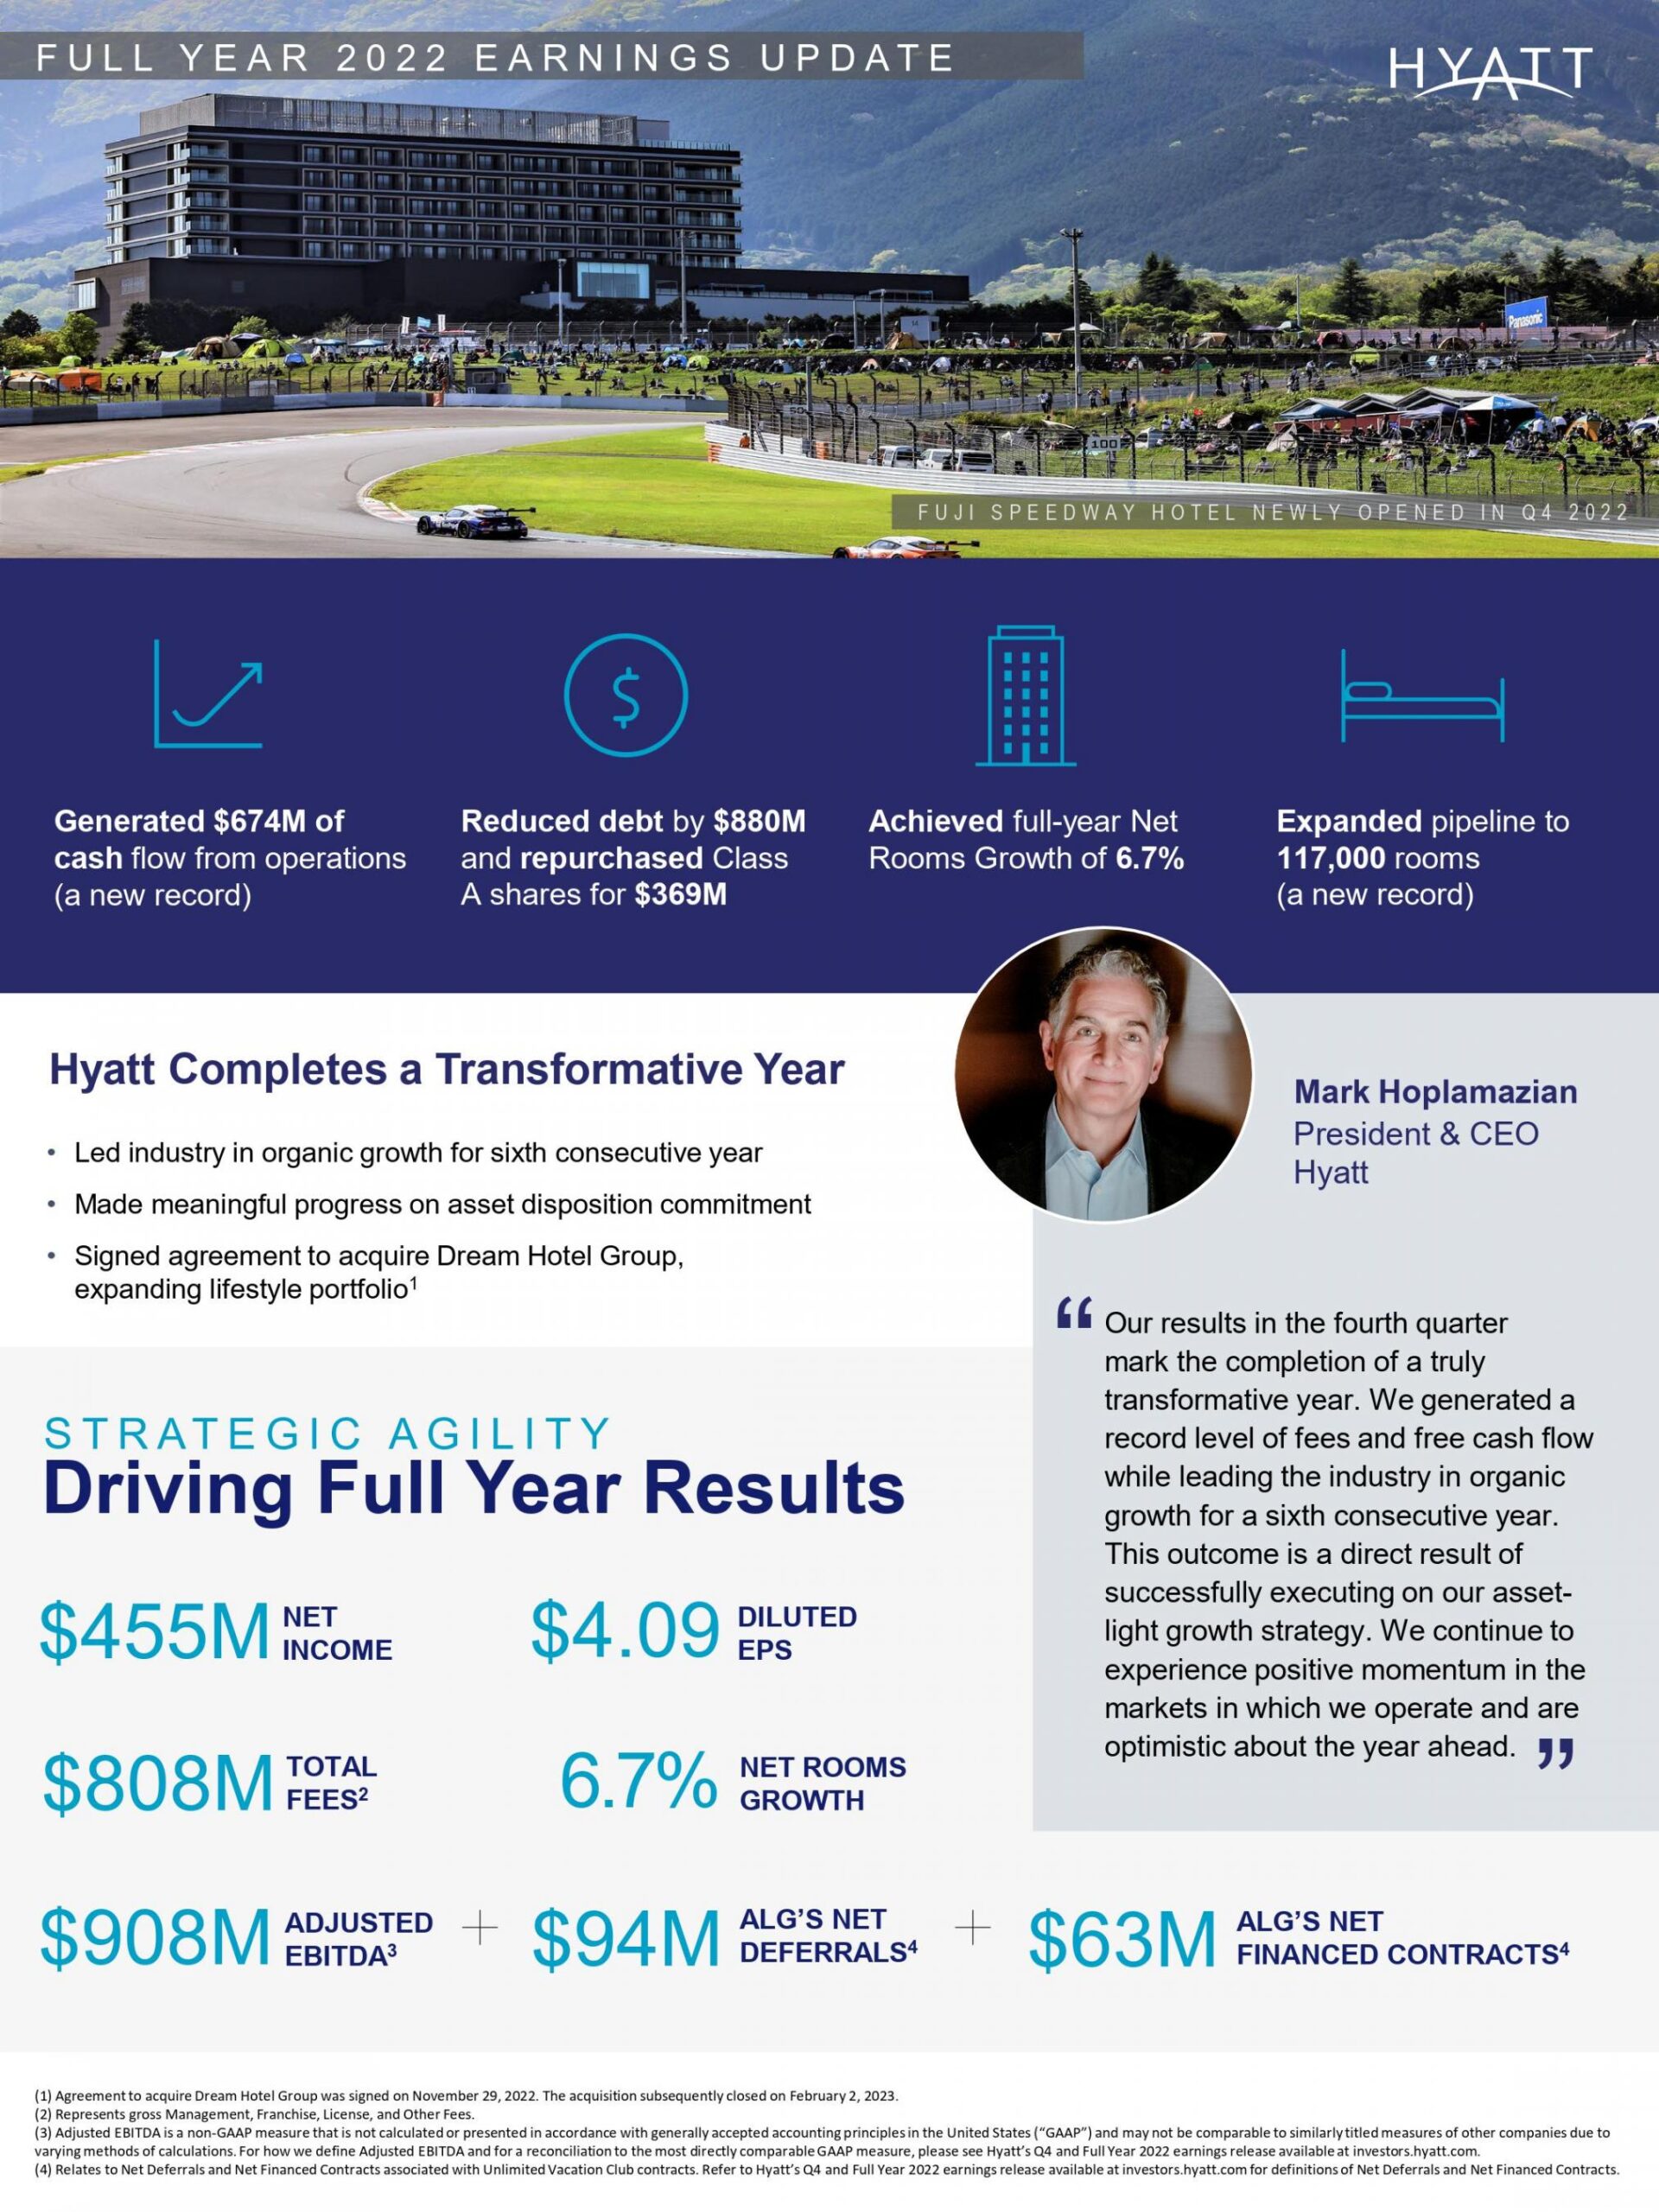
Adjusted EBITDA was $232 million in the fourth quarter and $908 million for the full year of 2022.
CHICAGO – Hyatt Hotels Corporation reported fourth quarter and full year 2022 financial results. Highlights include:
- Net income was $294 million in the fourth quarter and $455 million for the full year of 2022. Adjusted net income was $278 million in the fourth quarter and $365 million for the full year of 2022. Net income in the fourth quarter and for the full year of 2022 includes a non-cash benefit of $250 million due to the release of a valuation allowance on U.S. federal and state deferred taxes.
- Diluted EPS was $2.69 in the fourth quarter and $4.09 for the full year of 2022. Adjusted Diluted EPS was $2.55 in the fourth quarter and $3.28 for the full year of 2022.
- Adjusted EBITDA was $232 million in the fourth quarter and $908 million for the full year of 2022. Apple Leisure Group (“ALG”) contributed $43 million of Adjusted EBITDA in the fourth quarter and $231 million for the full year of 2022.
- Adjusted EBITDA does not include ALG’s Net Deferrals of $28 million and $94 million, and Net Financed Contracts of $15 million and $63 million, in the fourth quarter and for the full year of 2022, respectively.
- Comparable system-wide RevPAR increased 34.8% in the fourth quarter and 60.2% for the full year of 2022, compared to 2021.
- Comparable owned and leased hotels RevPAR increased 41.7% in the fourth quarter and 87.6% for the full year of 2022, compared to 2021. Comparable owned and leased hotels operating margin improved to 27.9% in the fourth quarter and to 27.1% for the full year of 2022.
- All-inclusive Net Package RevPAR was $190.64 in the fourth quarter and $187.28 for the full year of 2022.
- Net Rooms Growth was 6.7% for the full year of 2022.
Pipeline of executed management or franchise contracts was approximately 117,000 rooms, inclusive of ALG’s pipeline contribution of 8,000 rooms. Share repurchase activity was approximately 1.15 million shares repurchased for $106 million in the fourth quarter and approximately 4.23 million shares repurchased for $369 million for the full year of 2022.
Mark S. Hoplamazian, President and Chief Executive Officer of Hyatt, said, “Our results in the fourth quarter mark the completion of a truly transformative year. We generated a record level of fees and free cash flow while leading the industry in organic growth for a sixth consecutive year. This outcome is a direct result of successfully executing on our asset-light growth strategy. We continue to experience positive momentum in the markets in which we operate and are optimistic about the year ahead.”
Operational Update
Comparable system-wide RevPAR increased 2.4% in the fourth quarter and declined 6.1% for the full year of 2022, compared to the same periods in 2019. Excluding Greater China, system-wide RevPAR increased 6.6% in the fourth quarter and declined 2.5% for the full year of 2022, compared to the same periods in 2019. In the fourth quarter of 2022, the RevPAR recovery continued to be powered by strong pricing with leisure transient and group average rates up 19% and 15% compared to 2019 levels, respectively.
The ALG all-inclusive portfolio also continues to experience positive trends. Net package RevPAR for the same set of properties managed by ALG in the Americas increased 24.4% in the fourth quarter and 12.6% for the full year of 2022, compared to the same periods in 2019. Total Net package revenue for all ALG properties increased 65.4% in the fourth quarter and 48.2% for the full year of 2022, compared to the same periods in 2019, fueled by ALG’s net rooms growth in the Americas and significant expansion into Europe.
Segment Results and Highlights
| (in millions) | Three Months Ended December 31, | Year Ended December 31, | ||||
| 2022 | 20211 | 20192 | 2022 | 20211 | 20192 | |
| Owned and leased hotels | $88 | $57 | $98 | $307 | $91 | $389 |
| Americas management and franchising | 106 | 75 | 92 | 422 | 231 | 380 |
| ASPAC management and franchising | 16 | 8 | 28 | 42 | 29 | 87 |
| EAME/SW Asia management and franchising | 19 | 13 | 16 | 59 | 17 | 49 |
| Apple Leisure Group | 43 | 4 | — | 231 | 4 | — |
| Corporate and other | (40) | (45) | (42) | (154) | (116) | (152) |
| Eliminations | — | — | (1) | 1 | 1 | 1 |
| Adjusted EBITDA | $232 | $112 | $191 | $908 | $257 | $754 |
| Three Months Ended December 31, | Year Ended December 31, | |||||
| 2022 | 20211 | 2019 | 2022 | 20211 | 2019 | |
| Net Deferrals | $28 | $19 | $— | $94 | $19 | $— |
| Net Financed Contracts | $15 | $8 | $— | $63 | $8 | $— |
1 Includes results for the two month period of ownership following the acquisition of ALG during three months and year ended December 31, 2021.
2 Effective January 1, 2020, the results of Miraval are reported in the owned and leased hotels segment and Americas management and franchising segment. Fees from Hyatt Residence Club are reported in the Americas management and franchising segment. These changes are also reflected for the three months and year ended December 31, 2019.
- Owned and leased hotels segment: Comparable operating margins improved to 27.9% in the fourth quarter, reflecting strong operational execution and growth in average daily rates. Owned and leased hotels Adjusted EBITDA increased $8 million, or 10%, when adjusted for the net impact of transactions, in the fourth quarter compared to the same period in 2019.
- Americas management and franchising segment: Results in the fourth quarter were led by ongoing strength in leisure transient revenue. Additionally, group room revenue was 1.3% above 2019 levels. New hotels added to the system since the start of 2019 contributed $15 million in fee revenue during the quarter.
- ASPAC management and franchising segment: Results in the fourth quarter were below 2019 levels driven by Greater China. Asia Pacific, excluding Greater China, experienced an acceleration in demand with notable momentum in South Korea, Japan, and Southeast Asia.
- EAME/SW Asia management and franchising segment: Results in the fourth quarter were led by strong fee generation in the Middle East driven by the World Cup in Qatar. Additionally, the region enjoyed strong leisure demand throughout Europe.
- Apple Leisure Group segment: Results in the fourth quarter were led by the continued strength of leisure demand, favorable pricing, and airlift that remains above 2019 levels for key Americas destinations. ALG revenue and Adjusted EBITDA includes a $23 million non-cash benefit primarily from the expiration of unredeemed pandemic-related travel credits.
Openings and Development
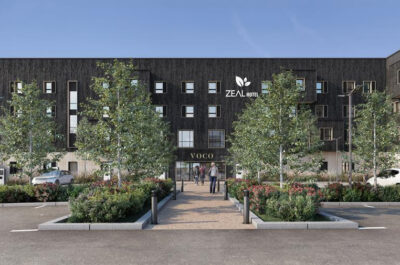
In the fourth quarter, 57 new hotels (or 10,784 rooms) joined Hyatt’s system. Notable openings included 31 franchised hotels (or 5,082 rooms), predominately across Germany, as part of Hyatt’s agreement with Lindner Hotels & Resorts, Secrets Impression Moxché, Hyatt Centric Ville-Marie Montréal, and Fuji Speedway Hotel and Grayson Hotel in New York City, both part of The Unbound Collection by Hyatt portfolio.
For the full year of 2022, 120 new hotels (or 23,227 rooms) joined Hyatt’s system with 48 properties (or 8,281 rooms) converted to a Hyatt brand.
As of December 31, 2022, the Company had a pipeline of executed management or franchise contracts for approximately 580 hotels (approximately 117,000 rooms), inclusive of ALG’s pipeline contribution of approximately 20 hotels (or approximately 8,000 rooms).
2023 Outlook
The company is providing the following guidance for the 2023 fiscal year:
|
Full Year 2023 vs. 2022 |
|
| System-Wide RevPAR1 |
10% to 15% |
|
Full Year 2023 vs. 2022 |
|
| Net Rooms Growth |
Approx. 6.0% |
| (in millions) |
Full Year 2023 HHC |
| Capital Expenditures |
Approx. $200 |
| Total Adjusted SG&A2 |
$480 – $490 |
| One-Time Integration Costs3 |
Approx. $15 |
1 RevPAR is based on constant currency whereby previous periods are translated based on the current period exchange rate. RevPAR percentage for 2023 vs. 2022 is based on comparable hotels.
2 Refer to the table on page A-18 of the schedules for a reconciliation of estimated selling, general, and administrative expenses to Adjusted selling, general, and administrative expenses.
3 One-time integration costs are related to acquisition activity and are included within Adjusted selling, general, and administrative expenses.
No disposition or acquisition activity beyond what has been completed as of the date of this release has been included in the 2023 Outlook. The Company’s 2023 Outlook is based on a number of assumptions that are subject to change and many of which are outside the control of the Company. If actual results vary from these assumptions, the Company’s expectations may change. There can be no assurance that Hyatt will achieve these results.

Tatiana is the news coordinator for TravelDailyNews Media Network (traveldailynews.gr, traveldailynews.com and traveldailynews.asia). Her role includes monitoring the hundreds of news sources of TravelDailyNews Media Network and skimming the most important according to our strategy.
She holds a Bachelor's degree in Communication & Mass Media from Panteion University of Political & Social Studies of Athens and she has been editor and editor-in-chief in various economic magazines and newspapers.