Strong demand and strength in onboard spend drive first quarter earnings
MIAMI – Royal Caribbean Group reported first quarter Earnings per Share (“EPS”) of $1.35 and Adjusted EPS of $1.77. These results were better than the company’s guidance due to stronger pricing on close-in demand, strength in onboard revenue and favorable timing of expenses. As a result of an exceptional WAVE season and continued strength in demand, the company is increasing 2024 Adjusted EPS guidance to $10.70 – $10.90 per share.
“Wow, what a great start to the year! Demand for our leading brands and the incredible experiences they deliver continues to be very robust, resulting in outperformance in the first quarter, a further increase of full year earnings guidance, and 60% expected earnings growth year over year,” said Jason Liberty, president and CEO, Royal Caribbean Group. “Building on this momentum, we expect to achieve all our Trifecta financial goals in 2024, which allows us to focus on a new era of growth to drive long-term shareholder returns and take a greater share of the rapidly growing $1.9 trillion global vacation market.”
Key Highlights
Stronger than anticipated demand led to a record WAVE season and continued strength in bookings in April from both a volume and pricing standpoint. This robust booking environment across all key itineraries coupled with continued strength in onboard spend, led to higher revenue versus guidance in the first quarter and a further improvement in full year yield expectations.
First Quarter 2024
- Load factors in the first quarter were 107%.
- Gross Margin Yields were up 60.3% as-reported. Net Yields were up 19.3% in Constant-Currency (19.5% as-reported).
- Gross Cruise Costs per Available Passenger Cruise Days (“APCD”) increased 5.1% as-reported. Net Cruise Costs (“NCC”), excluding Fuel, per APCD increased 4.1% in Constant-Currency (4.2% as-reported), which benefited from 325 bps of favorable timing of expenses.
- Total revenues were $3.7 billion, Net Income was $360 million or $1.35 per share, Adjusted Net Income was $478 million or $1.77 per share, Adjusted EBITDA was $1.2 billion, and operating cash flow was $1.3 billion.
Full Year 2024 Outlook
- Net Yields are expected to increase 9.0% to 10.0% in Constant-Currency and as-reported.
- NCC, excluding Fuel, per APCD is expected to increase approximately 5.5% in Constant-Currency (approximately 5.4% as-reported), including 310 bps of costs related to increased drydock days and the new operations of Hideaway Beach at Perfect Day at CocoCay. Approximately one third of the increase in unit costs, compared to prior guidance, is related to lower APCDs due to cancelled Red Sea Sailings with the remainder driven by higher stock-based compensation.
- Adjusted EPS is expected to grow 60% year over year and be in the range of $10.70 to $10.90. The increase in earnings includes a $0.10 headwind related to a stronger dollar and higher fuel prices. Approximately one third of the increase is attributable to the first quarter business outperformance with the remainder mainly driven by better business outlook, lower interest expense but also higher stock-based compensation.
- The company expects to achieve all of its Trifecta financial goals in 2024: triple digit EBITDA per APCD, ROIC in the teens, and double digit EPS, one year earlier than prior expectations.
First Quarter 2024 Results
Net Income for the first quarter of 2024 was $360 million or $1.35 per share compared to Net Loss of $(48) million or $(0.19) per share for the same period in the prior year. Adjusted Net Income was $478 million or $1.77 per share for the first quarter of 2024 compared to Adjusted Net Loss of $(59) million or $(0.23) per share for the same period in the prior year. The company also reported total revenues of $3.7 billion and Adjusted EBITDA of $1.2 billion.
Gross Margin Yields increased 60.3% as-reported, and Net Yields increased 19.3% in Constant Currency (19.5% as-reported) when compared to the first quarter of 2023. Load factor for the quarter was 107%, up 5 percentage points compared to the first quarter of 2023. About half of the first quarter yield growth was driven by higher ticket pricing on existing hardware, with the remainder driven by a combination of onboard revenue rates, higher load factors, and new hardware. While onboard revenue continues to grow, the company is particularly pleased with the significant increase in ticket rates compared to 2023.
Gross Cruise Costs per APCD increased 5.1% as-reported, compared to 2023. NCC, excluding Fuel, per APCD increased 4.1% in Constant Currency (4.2% as-reported), when compared to the first quarter 2023. Costs were favorable to prior guidance due to the timing of expenses.
Update on Bookings
The demand and pricing environment continues to be very strong. Overall, this has been the strongest WAVE season in the company’s history from both a demand and pricing standpoint. As a result, the company continues to be in a record booked position, with rates for 2024 sailings even further ahead of 2023 than they were at the beginning of the year. In addition to record ticket pricing, consumer spending onboard and pre-cruise purchases continue to exceed prior years driven by greater participation at higher prices.
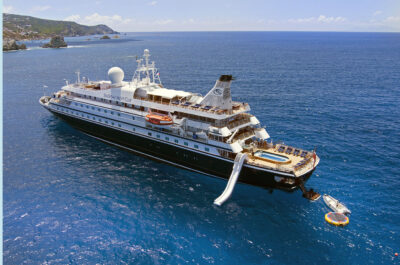
“Our existing fleet along with our new ships continue to perform exceptionally well, highlighted by the market response to the launch of Icon of the Seas, which has exceeded all expectations,” added Liberty. “The momentum continues with Utopia of the Seas and Silver Ray, set to launch this summer. And, just this quarter alone, we announced an order for a seventh Oasis Class ship and the expansion of our Royal Beach Club portfolio in Cozumel; and we officially broke ground on Royal Beach Club Paradise Island. These strategies will further propel our leadership in the cruise industry and push us to new heights in the vacation industry.”
As of March 31, 2024, the Group’s customer deposit balance was at $6.0 billion.
Second Quarter 2024
Net Yields are expected to increase 10.20% to 10.70% in Constant Currency (10.0% to 10.5% as-reported).
NCC, excluding Fuel, per APCD, is expected to increase 7.4% to 7.9% in Constant Currency (7.2% to 7.7% as-reported) compared to 2023 and includes costs related to increased drydock days and the operations of Hideaway Beach, as well as timing of costs shifted from the first quarter.
Based on current fuel pricing, interest rates, currency exchange rates and the factors detailed above, the company expects second quarter Adjusted EPS to be in the range of $2.65 to $2.75.
Fuel Expense
Bunker pricing, net of hedging, for the first quarter was $696 per metric ton and consumption was 437,000 metric tons.
The company does not forecast fuel prices and its fuel cost calculations are based on current at-the-pump prices, net of hedging impacts. Based on today’s fuel prices, the company has included $291 million of fuel expense in its second quarter guidance at a forecasted consumption of 416,000 metric tons, which is 61% hedged via swaps. Forecasted consumption is 61%, 45%, and 24% hedged via swaps for 2024, 2025, and 2026, respectively. The annual average cost per metric ton of the hedge portfolio is approximately $504, $468, and $479 for 2024, 2025, and 2026, respectively.
The company provided the following guidance for the first quarter and full year 2024:
| FUEL STATISTICS | Second Quarter 2024 | Full Year 2024 |
| Fuel Consumption (metric tons) | 416,000 | 1,720,000 |
| Fuel Expenses | $291 million | $1,183 million |
| Percent Hedged (fwd. consumption) | 61 % | 61 % |
| GUIDANCE | As-Reported | Constant Currency |
| Second Quarter 2024 | ||
| Net Yields vs. 2023 | 10.0% to 10.5% | 10.2% to 10.7% |
| Net Cruise Costs per APCD vs. 2023 | 6.1% to 6.6% | 6.2% to 6.7% |
| Net Cruise Costs per APCD ex. Fuel vs. 2023 | 7.2% to 7.7% | 7.4% to 7.9% |
| Full Year 2024 | ||
| Net Yields vs. 2023 | 9.0% to 10.0% | 9.0% to 10.0% |
| Net Cruise Costs per APCD vs. 2023 | Approximately 3.7% | Approximately 3.7% |
| Net Cruise Costs per APCD ex. Fuel vs. 2023 | Approximately 5.4% | Approximately 5.5% |
| GUIDANCE | Second Quarter 2024 | Full Year 2024 |
| APCDs | 12.2 million | 50.7 million |
| Capacity change vs. 2023 | 4.6 % | 8.1 % |
| Depreciation and amortization | $390 to $400 million | $1,600 to $1,610 million |
| Net Interest, excluding loss on extinguishment of debt | $270 to $280 million | $1,140 to $1,150 million |
| Adjusted EPS | $2.65 to $2.75 | $10.70 to $10.90 |
| SENSITIVITY | Second Quarter 2024 | Full Year 2024 |
| 1% Change in Currency | $3 million | $14 million |
| 1% Change in Net Yields | $29 million | $120 million |
| 1% Change in NCC excluding Fuel | $14 million | $60 million |
| 100 basis pt. Change in SOFR | $1 million | $9 million |
| 10% Change in Fuel prices | $15 million | $45 million |
| Exchange rates used in guidance calculations | ||
| GBP | $1.26 | |
| AUD | $0.65 | |
| CAD | $0.73 | |
| EUR | $1.07 | |
Theodore is the Co-Founder and Managing Editor of TravelDailyNews Media Network; his responsibilities include business development and planning for TravelDailyNews long-term opportunities.


