


In July, domestic travel volume experienced a 21.5% year-over-year increase compared to the same period in 2022 and outperformed July 2019 levels by 8.3%. The month marked a record high in Revenue Passenger Kilometers (RPKs), largely fueled by a robust uptick in demand within China’s domestic market.
GENEVA – The International Air Transport Association (IATA) announced that the post-COVID recovery momentum continued in July for passenger markets.
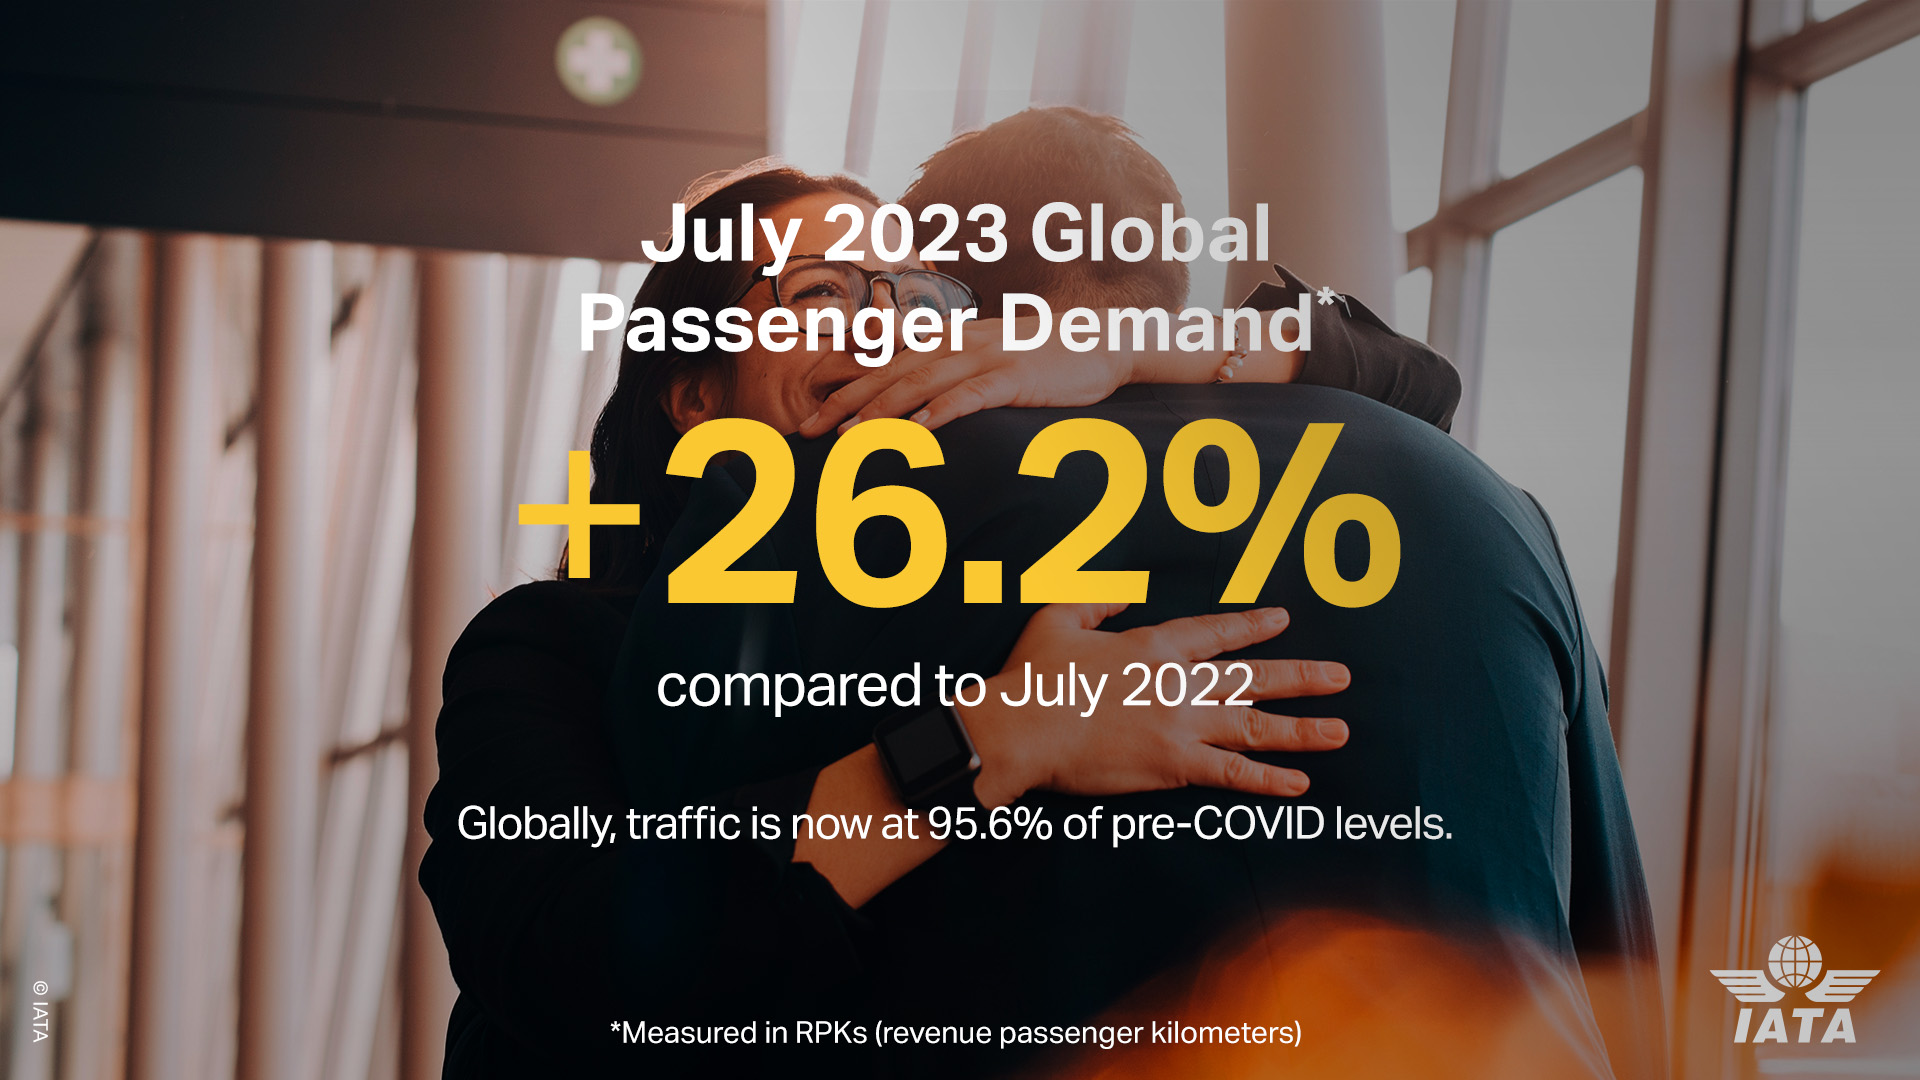
- Total traffic in July 2023 (measured in revenue passenger kilometers or RPKs) rose 26.2% compared to July 2022. Globally, traffic is now at 95.6% of pre-COVID levels.
- Domestic traffic for July rose 21.5% versus July 2022 and was 8.3% above the July 2019 results. July RPKs are the highest ever recorded, strongly supported by surging demand in the China domestic market.
- International traffic climbed 29.6% compared to the same month a year ago with all markets showing robust growth. International RPKs reached 88.7% of July 2019 levels. The passenger load factor (PLF) for the industry reached 85.7% which is the highest monthly international PLF ever recorded.
“Planes were full during July as people continue to travel in ever greater numbers. Importantly, forward ticket sales indicate that traveler confidence remains high. And there is every reason to be optimistic about the continuing recovery,” said Willie Walsh, IATA’s Director General.
Air Passenger Market in Detail
| JULY 2023 (%YEAR-ON-YEAR) | WORLD SHARE *1 | RPK | ASK | PLF (%PT) *2 | PLF (LEVEL) *3 |
|---|---|---|---|---|---|
|
Total Market
|
100%
|
26.2%
|
23.7%
|
1.7%
|
85.2%
|
|
Africa
|
2.1%
|
25.0%
|
26.3%
|
-0.8%
|
74.6%
|
|
Asia Pacific
|
22.1%
|
67.1%
|
53.4%
|
6.7%
|
81.6%
|
|
Europe
|
30.8%
|
11.7%
|
11.5%
|
0.2%
|
87.7%
|
|
Latin America
|
6.4%
|
15.5%
|
11.4%
|
3.1%
|
86.7%
|
|
Middle East
|
9.8%
|
21.9%
|
21.0%
|
0.6%
|
82.1%
|
|
North America
|
28.8%
|
13.2%
|
11.9%
|
1.0%
|
89.7%
|
(*1) % of industry RPKs in 2022 (*2) Change in load factor (*3) Load factor level
International Passenger Markets
- Asia-Pacific airlines saw a 105.8% increase in July 2023 traffic compared to July 2022, continuing to lead the regions. Capacity climbed 96.2% and the load factor increased by 3.9 percentage points to 84.5%.
- European carriers’ July traffic rose 13.8% versus July 2022. Capacity increased 13.6%, and load factor edged up 0.1 percentage points to 87.0%.
- Middle Eastern airlines posted a 22.6% increase in July traffic compared to a year ago. Capacity rose 22.1% and load factor climbed 0.3 percentage points to 82.6%.
- North American carriers had a 17.7% traffic rise in July 2023 versus the 2022 period. Capacity increased 17.2%, and load factor improved 0.3 percentage points to 90.3%, which was the highest among the regions for a second consecutive month.
- Latin American airlines’ traffic rose 25.3% compared to the same month in 2022. July capacity climbed 21.2% and load factor rose 2.9 percentage points to 89.1%.
- African airlines saw a 25.6% traffic increase in July 2023 versus a year ago, the second highest percentage gain among the regions. July capacity was up 27.4% and load factor fell 1.0 percentage point to 73.9%, the lowest among the regions. For a second month in a row, Africa was the only region to see capacity growth outrun traffic demand.
Domestic Passenger Markets
| JULY 2023 (%YEAR-ON-YEAR) | WORLD SHARE *1 | RPK | ASK | PLF (%PT) *2 | PLF (LEVEL) *3 |
|---|---|---|---|---|---|
|
Domestic
|
41.9%
|
21.5%
|
16.7%
|
3.3%
|
84.5%
|
|
Dom. Australia
|
1.0%
|
3.5%
|
8.5%
|
-4.1%
|
83.2%
|
|
Dom. Brazil
|
1.5%
|
3.6%
|
-0.1%
|
3.0%
|
83.4%
|
|
Dom. China P.R.
|
6.4%
|
71.9%
|
49.1%
|
10.5%
|
79.2%
|
|
Dom. India
|
2.0%
|
21.1%
|
13.3%
|
5.3%
|
83.3%
|
|
Dom. Japan
|
1.2%
|
13.4%
|
1.3%
|
7.8%
|
72.7%
|
|
Dom. USA
|
19.2%
|
11.1%
|
9.5%
|
1.3%
|
89.2%
|
(*1) % of industry RPKs in 2022 (*2) Change in load factor (*3) Load factor level
- China’s domestic traffic jumped 71.9% in July compared to a year ago and is now 22.5% above July 2019 levels, which was the strongest gain against pre-pandemic levels among the domestic markets.
- US airlines’ domestic demand climbed 11.1% in July and was 3.0% above the July 2019 level.
Air Passenger Market Overview
| JULY 2023 (% CH VS SAME MONTH IN 2019) | WORLD SHARE1 | RPK | ASK | PLF (%-PT)2 | PLF (LEVEL)3 |
|---|---|---|---|---|---|
|
Total Market
|
100.0%
|
-4.4%
|
-3.9%
|
-0.4%
|
85.2%
|
|
International
|
58.1%
|
-11.3%
|
-11.7%
|
0.4%
|
85.7%
|
|
Domestic
|
41.9%
|
8.3%
|
10.4%
|
-1.7%
|
84.5%
|
1) % of industry RPKs in 2022 2) year-on-year change in load factor 3) Load Factor Level
“The Northern Hemisphere summer is living up to expectations for very strong traffic demand. While the industry was largely prepared to accommodate a return to pre-pandemic levels of operations, unfortunately, the same cannot be said for our infrastructure providers. Performance of some of the key air navigations services providers, for example, has been deeply disappointing for many reasons from insufficient staffing to the failure fiasco of NATS in the UK. These must be promptly corrected. Even more worrying, however, are political decisions by some governments—among them Mexico and the Netherlands—to impose capacity cuts at their major hubs that will most certainly destroy jobs and damage local and national economies. The numbers continue to tell us that people want and need air connectivity. That’s why governments should be working with us so that people can travel safely, sustainably and efficiently,” said Walsh.

Theodore is the Co-Founder and Managing Editor of TravelDailyNews Media Network; his responsibilities include business development and planning for TravelDailyNews long-term opportunities.