


Earned net income of $9.4 million compared to net income of $9.3 million in the 2022 second quarter. Net income per diluted common share was $0.15 versus $0.15 during the 2022 second quarter.
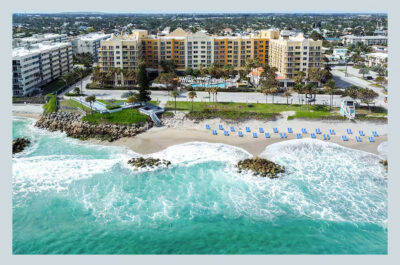
WEST PALM BEACH, FLA. – Chatham Lodging Trust, a lodging real estate investment trust (REIT) that invests in upscale, extended-stay hotels and premium-branded, select-service hotels, today announced results for the second quarter ended June 30, 2023.
Second Quarter 2023 Operating Results
- Portfolio Revenue Per Available Room (RevPAR) – Increased 5 percent to $144 compared to 2022 second quarter RevPAR of $138. Average daily rate (ADR) accelerated 2 percent to $182, and occupancy rose 2 percent to 79 percent for the 39 hotels owned as of June 30, 2023.
RevPAR of $144 compares to $146 in 2019. ADR was up 3 percent to 2019. - Excluding the five tech-driven hotels in Silicon Valley and Seattle, Wash., RevPAR was up 5 percent versus the 2019 second quarter. ADR was up 10 percent.
- Net Income – Earned net income of $9.4 million compared to net income of $9.3 million in the 2022 second quarter. Net income per diluted common share was $0.15 versus $0.15 during the 2022 second quarter.
- Hotel EBITDA Margin – Generated margins of 41.3 percent in the 2023 second quarter compared to 2022 second quarter margins of 41.9 percent.
- Adjusted EBITDA – Advanced 2 percent to $31.9 million from $31.1 million in the 2022 second quarter.
- Adjusted FFO – Jumped 5 percent from $20.7 million in the 2022 second quarter to adjusted FFO of $21.8 million this year. – Adjusted FFO per diluted share was $0.43, compared to $0.41 in the 2022 second quarter.
- Debt Repayments – Repaid in full a $16.0 million mortgage on the Courtyard by Marriott Houston, Texas. During July, Chatham repaid a separate $19.7 million maturing mortgage.
The following chart summarizes the consolidated financial results for the three and six-months ended June 30, 2023, and 2022, based on all properties owned during those periods ($ in millions, except margin percentages and per share data):
| Three Months Ended | Six Months Ended | ||||||
| June 30, | June 30, | ||||||
| 2023 | 2022 | 2023 | 2022 | ||||
| Net income (loss) | $9.4 | $9.3 | $4.3 | $(0.4) | |||
| Diluted net income (loss) per common share | $0.15 | $0.15 | $0.01 | $(0.09) | |||
| GOP Margin | 48.5% | 49.2% | 44.6% | 44.8% | |||
| Hotel EBITDA Margin | 41.3% | 41.9% | 36.6% | 36.8% | |||
| Adjusted EBITDA | $31.9 | $31.1 | $49.6 | $44.4 | |||
| AFFO | $21.8 | $20.7 | $29.7 | $24.2 | |||
| AFFO per diluted share | $0.43 | $0.41 | $0.59 | $0.48 | |||
| Dividends per common share | $0.07 | $0.00 | $0.14 | $0.00 | |||
Jeffrey H. Fisher, Chatham’s president and chief executive officer, highlighted, “It was a really good quarter with RevPAR, Adjusted EBITDA, FFO and FFO per share growing over last year and producing free cash flow that enabled us to repay a maturing loan in early July. With only $70 million of mortgages maturing through June 30, 2024, and having full availability on our $260 million credit facility, our balance sheet is in great shape, and we are in a strong position to address all maturities through the end of 2024.
“Our second quarter year-over-year RevPAR growth of five percent was strong given the loss of most intern business in Silicon Valley and Bellevue, Wash. Versus 2019, second quarter RevPAR was down less than two percent, and the trend to 2019 improved each month of 2023 through June,” Fisher continued. “Those five hotels adversely impacted RevPAR performance versus 2019 by approximately 700 basis points in the quarter. Excluding those five tech-driven hotels, second quarter RevPAR growth was up five percent versus the 2019 second quarter.”
Hotel RevPAR Performance
The below chart summarizes key hotel financial statistics for the hotels owned as of June 30, 2023, compared to the 2022 and 2019 second quarter:
| Q2 2023 RevPAR | Q2 2022 RevPAR | Q2 2019 RevPAR | |||
| Occupancy | 79% | 77% | 83% | ||
| ADR | $182 | $179 | $176 | ||
| RevPAR | $144 | $138 | $146 |
The below chart summarizes RevPAR statistics by month for the company’s hotels:
| April | May | June | July | ||||
| Occupancy – 2023 | 77% | 78% | 82% | 81% | |||
| ADR – 2023 | $179 | $179 | $189 | $189 | |||
| RevPAR – 2023 | $138 | $140 | $155 | $154 | |||
| RevPAR – 2022 | $123 | $133 | $157 | $157 | |||
| % Change in RevPAR vs. prior year | 12% | 5% | (1)% | (2)% | |||
| % Change in RevPAR vs. 2019 | (3)% | (2)% | (1)% | (2)% |
Fisher emphasized, “As we have pointed out previously, we knew our portfolio would recover after some of our peers due to our stronger reliance on the business traveler, and that pattern is proving true. For the fifth consecutive quarter, our RevPAR growth has outperformed industry RevPAR growth, and given the lack of intern business in all of our tech driven hotels, which includes two additional hotels in Austin, Texas, that were meaningfully impacted, our results have been particularly impressive and prove that business travel is picking up momentum across the country.
“Continuing the same trend from the first quarter, versus 2019, weekday occupancy in the second quarter improved each month of 2023 and was 78 percent for the entire second quarter. This is up approximately three percent over last year, again impressive given the adverse impact from the loss of most intern business year-over-year. Weekday ADR was up approximately three percent versus last year and, importantly, up slightly versus 2019. Weekend RevPAR remained strong as it was up approximately 15 percent in the quarter versus 2019, the highest quarterly levels since 2019,” Fisher concluded.
RevPAR performance for Chatham’s largest markets comprise 68 percent of trailing twelve-month hotel EBITDA (based on EBITDA contribution over the last twelve months) is presented below:
| % OF LTM EBITDA | Q2 2023 RevPAR | Change vs. Q2 2022 | Q2 2022 RevPAR | Q2 2019 RevPAR | |||||
| 39 – Hotel Portfolio | $144 | 5% | $138 | $146 | |||||
| Silicon Valley | 15% | $139 | (3)% | $142 | $194 | ||||
| Coastal Northeast | 9% | $174 | 10% | $158 | $157 | ||||
| Los Angeles | 9% | $170 | 7% | $158 | $162 | ||||
| Washington, D.C. | 8% | $174 | 11% | $156 | $185 | ||||
| San Diego | 6% | $191 | 2% | $187 | $177 | ||||
| Greater New York | 6% | $155 | 1% | $154 | $153 | ||||
| Austin | 6% | $135 | (5)% | $142 | $132 | ||||
| Dallas | 5% | $109 | 3% | $107 | $94 | ||||
| Seattle | 4% | $137 | (9)% | $150 | $166 |
“Our Silicon Valley, Austin and Seattle markets were hit by the significant reduction in intern programs, while most of our other top markets produced solid RevPAR growth, and six of our top nine markets produced RevPAR higher than 2019,” noted Dennis Craven, Chatham’s chief operating officer. “On our first quarter earnings call, we estimated that demand was sufficient to make up 50 to 75 percent of the lost intern business in Silicon Valley and Seattle, and, in fact, we made up 63 percent of the lost revenue. As we look ahead to 2024, results at these hotels should outpace portfolio performance.”
Craven added, “Traditional demand in Silicon Valley and Seattle continues to grow, driven by the steady return to office and increased demand from international travelers. International deplanements into San Francisco/San Jose, as well as Seattle, keep improving to their highest levels since the pandemic. Deplanements were off approximately 11 percent versus 2019 into San Francisco/San Jose and were up three percent versus 2019 into Seattle. Weekday occupancy at the four Silicon Valley hotels was approximately 77 percent in the second quarter, not far off our portfolio average of 78 percent.”
Approximately 62 percent of Chatham’s hotel EBITDA over the last twelve months was generated from its extended-stay hotels, the highest concentration of extended-stay rooms of any public lodging REIT. Second quarter 2023 occupancy, ADR and RevPAR for each of the company’s major brands is presented below (number of hotels in parentheses):
| Residence Inn (16) | Homewood Suites (6) | HGI (4) | Courtyard (4) | Hampton Inn (3) | |||||
| % of LTM EBITDA | 46% | 11% | 9% | 9% | 7% | ||||
| Occupancy – 2023 | 80% | 80% | 78% | 71% | 84% | ||||
| ADR – 2023 | $191 | $153 | $203 | $153 | $179 | ||||
| RevPAR – 2023 | $152 | $122 | $158 | $109 | $150 | ||||
| RevPAR – 2022 | $152 | $118 | $144 |

Tatiana is the news coordinator for TravelDailyNews Media Network (traveldailynews.gr, traveldailynews.com and traveldailynews.asia). Her role includes monitoring the hundreds of news sources of TravelDailyNews Media Network and skimming the most important according to our strategy.
She holds a Bachelor's degree in Communication & Mass Media from Panteion University of Political & Social Studies of Athens and she has been editor and editor-in-chief in various economic magazines and newspapers.