


Using airport data gathered throughout 2015 from the Bureau of Transportation Statistics, Travelmath ranked 322 U.S. airports based on their results in six categories. These included: delays, average fares and TSA incidents. Here’s a quick look at the findings:
- Airports in the Western U.S. dominated the Top 20
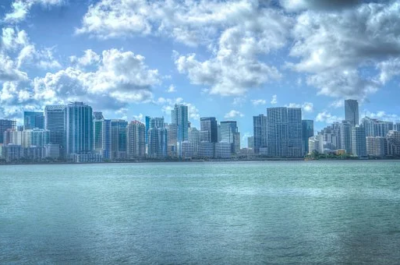
- With 0 TSA claims and under 3% of flights being delayed, the highest ranked airport in the country is Canyonlands Field Airport in Moab, Utah
- Newark Liberty International, having 341 TSA claims and almost 27% flight delays, is the lowest ranked airport in 2015.
- When it comes to travel, the quality of the airports you take flight from and touch down at can have a big impact on your trip overall. Flight delays, cancellations, lost baggage claims, fare prices – these types of experiences can make or break your trip. Many travel rankings take into account airline reviews and even flight path feedback, but we’ve ranked the airports themselves to give you an inside look into the nation’s best and worst options. Using information collected from the Bureau of Transportation Statistics throughout 2015 so far, Travelmath was able to rank 322 airports across the United States based on their results in each category.

This year’s travel rankings reveal the range of quality in airports of all sizes across the United States. The No. 1-ranked airport in the country is Canyonlands Field Airport in Moab, Utah. Overall, Western states including Utah, Idaho, Montana, Washington, Hawaii, and Alaska dominate the list of the top 20 airports, suggesting that the country’s best airports are located mostly in the West. All but six of the top 20 top-ranked airports were also the least busy (less than 1,000 flight volume) – in other words, the country’s smallest airports are also its top ranked.
The country’s lowest-ranked airports, on the other hand, are not grouped or limited by region. Instead, the overwhelming trend shows that the higher the air traffic, the more airport rankings suffer. In fact, more than half of the country’s 20 lowest-ranked airports serviced more than 10,000 flights. Some of the country’s busiest airports are located in major cities, and, surprisingly, many of these well-known airports rank at the bottom of the list.
The New York City area’s three major airports, for example, all rank in the bottom 10. John F. Kennedy International Airport ranks No. 315 overall, while New York’s LaGuardia Airport and Newark Liberty International in New Jersey come in at 321 and 322, respectively – the nation’s lowest rankings. Large commuter hub airports and airports that service a substantial number of connecting flights across the country and around the world also rank quite poorly: Chicago O’Hare International Airport is No. 319, and Washington Dulles International stands at No. 320.

Canyonlands Field in Utah is the country’s top-ranked airport – and it also falls in the category of smallest airports (based on flight volume). This connection is no coincidence: Along with being dominated by Western states, the list of the 20 best airports overall includes all of the 10 smallest airports (less than 1,000 flight volume). That’s not to say that there aren’t some low-ranked small airports. In fact, Columbia Regional falls into the smallest airport category by flight volume and it ranks No. 317 overall, landing it in the five worst airport rankings in the country. The overall trend of small airports with high rankings ends as airport size increases – larger airports have considerably lower average airport rankings.
For the top 10 airports in the smallest airport category (1–999 flight volume), the average ranking is 6. But in the very next category (flight volume of 1,000 to 9,999), the average ranking plummets to 129.3. The larger the airport, the worse the ranking – until the largest airport category (75,000+ flight volume). For this group, the average ranking is 248 – which is actually better than the next-smallest group (50,000–74,999 flight volume), whose average ranking is 260.2.
This higher mark for busier airports could be attributed to the high performance pressure and steep requirements for airports that service so many flights. With hundreds of thousands of travelers passing through their gates, these airports are expected to provide not only efficiency but also a certain level of service that could help boost their rankings. Atlanta’s Hartsfield-Jackson International Airport, for example, is the busiest airport in the country (253,577 flights so far this year), and it ranks No. 222 – in the bottom half of nationwide airport rankings but considerably higher than others in its flight category, including New York LaGuardia and Dallas/Fort Worth International.

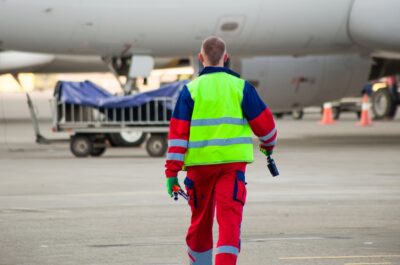
When it comes to international travel, your experience at a United States Customs and Border Protection (CBP) checkpoint can greatly impact your airport experience. Customs declarations and document checks should be taken seriously, but travelers who have faced long wait times in endless customs queues know that this final step in an arrivals process can put a definite damper on the trip. Of course, airport professionals do all that they can to expedite customs and border protection processes while still respecting the federal protocols and checks that CBP agents are required to oversee.
The 2015 data records show that overall, airports that service more international flights (based on flight volume) have longer customs and border patrol wait times. For example, Miami has become a travel destination not only for its beaches but also for its international flair and rich Latin influence from Florida’s Central and South American neighbors. Around 2.5 million immigrants live in the metro Miami area alone, and immigrants make up more than 65% of the city’s labor force. As Miami International Airport holds fast as an international arrivals and immigration hub, an important responsibility falls on U.S. Customs and Border Protection agents to be diligent in verifying documentation for new arrivals.
Unfortunately, this diligence combined with high flight volume can lead to longer wait times at customs and border protection checkpoints. Miami International Airport has the longest average normal wait time at almost 22 minutes, as well as the longest average maximum wait time at approximately 52.5 minutes. But contrary to popular belief, increasing the number of booths available for CBP agents to process arrivals doesn’t necessarily improve wait time. Miami International has an average of 22 U.S. Customs and Border Protection booths open at any one time; in contrast, Palm Beach International holds the lowest average normal and maximum wait times, at around 5.5 minutes and 11.5 minutes, respectively. And though it has the lowest wait times on average in the entire country, the CBP checkpoint at Palm Beach International only has one agent booth open on average.
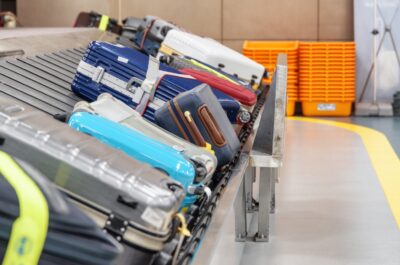
The country’s most popular and lowest-ranked airports also experience the most reported claims to the Transportation Security Administration (TSA). Travelers often use TSA claims to report lost or stolen personal property, but it may come as a surprise to see that personal electronics don’t top the list of missing items. Sporting equipment and supplies are the most commonly reported lost or stolen items, with 705 instances reported in 2014. Reports of lost or stolen clothing also beat personal electronics, with 312 reported incidents. These findings suggest that TSA claims are reported in the baggage area, where travelers discover that their oversized sporting equipment and checked baggage has been misplaced by the airline or even stolen by other travelers.
The five U.S. airports with the most reported claims are John F. Kennedy International, Los Angeles International, Orlando International, Newark Liberty International, and Miami International – all airports with overall rankings in the lowest quarter of the country. TSA officials at John F. Kennedy International received 644 claim reports in 2014, and Los Angeles International received 454 claims. These airports and the other eight with the most TSA claims filed all see a flight volume of more than 50,000 on average. Most of them experience flight volumes surpassing 75,000 or even 100,000 flights on average. With this many travelers, it’s no wonder TSA claims are so high in the country’s most popular airports.
Many different elements of travel factor into the overall experience, but airports play an important role in this assessment. Airport quality rankings, efficiency standings, and even border protection wait times all contribute to overall travel experience, so choosing the right airport can make all the difference. Next time you’re looking to book any kind of domestic or international flight, read up on the pros and cons of departures and arrivals at airports across the United States. Because many popular cities and states in the U.S. play host to multiple airports, you might even be able to choose a higher-ranked airport in your destination city based on the 2015 Airport Rankings report.
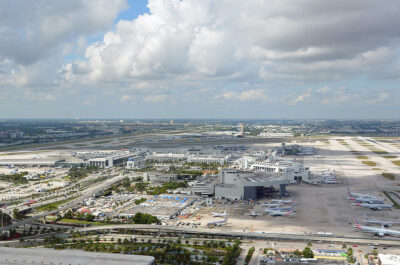
Photo caption: The No. 1-ranked airport in the country is Canyonlands Field Airport in Moab, Utah.

Tatiana is the news coordinator for TravelDailyNews Media Network (traveldailynews.gr, traveldailynews.com and traveldailynews.asia). Her role includes monitoring the hundreds of news sources of TravelDailyNews Media Network and skimming the most important according to our strategy.
She holds a Bachelor's degree in Communication & Mass Media from Panteion University of Political & Social Studies of Athens and she has been editor and editor-in-chief in various economic magazines and newspapers.