Monthly statistics released by ACI in two reports PaxFlash and FreightFlash clearly indicate the steady traffic growth trend of 2004…
Monthly statistics released by ACI in two reports PaxFlash and FreightFlash clearly indicate the steady traffic growth trend of 2004 and early 2005. Paul Behnke, ACI Director for Economics, calls the monthly figures more evidence that the industry is sustaining its prolonged upturn.
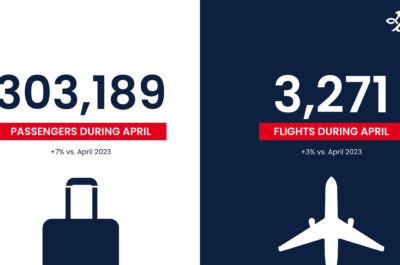
The figures show that in March passenger traffic continued to rise at an impressive clip and that cargo growth, although subdued, climbed back from a temporary reduction in February. Easter holidays in March 2005 buoyed total passenger traffic to a 7.6% increase, with international up 11.3 % and domestic 4.3% as compared to March 2004.
Total freight handled worldwide increased 2.4%, with both international up 2.6% and domestic up 3.3% compared to March 2004. Looking at year-to-date figures, strong results in Middle East, Latin America and Asia Pacific offset the drops in Africa and North America.
Behnke adds, These are encouraging figures that are in line with ACI forecasts. I want to raise a red flag to remind our aviation partners and legislators that we must build for the future. Sufficient airport capacity is a precondition for satisfying this growing consumer demand and avoiding congestion, which already threatens to affect passenger throughput this summer.
The high level results are summarized in the following charts:
|
STATS REGIONS |
MONTH |
YTD |
Rolling YEAR-END |
|
TOTAL PASSENGERS |
|||
|
AFR |
15.0 |
11.3 |
10.6 |
|
ASP |
10.3 |
7.5 |
18.5 |
|
EUR |
6.4 |
5.0 |
6.5 |
|
LAC |
14.5 |
15.2 |
15.3 |
|
MEA |
13.6 |
10.6 |
16.6 |
|
NAM |
5.8 |
6.0 |
9.0 |
|
ACI |
7.6 |
6.5 |
10.4 |
|
|
|||
|
INTERNATIONAL PASSENGERS |
|||
|
ACI |
11.3 |
8.6 |
13.0 |
|
|
|||
|
DOMESTIC PASSENGERS |
|||
|
ACI |
4.3 |
5.0 |
8.5 |
|
Total: International + Domestic +Direct Transit Passengers counted once (when breakdown is available) |
|||
|
International: Traffic (passengers) performed between the designated airport and an airport in another country/territory |
|||
|
Domestic: Traffic (passengers) performed between two airports located in the same country/territory |
|||
|
FreightFlash Summary March 2005 |
|||
|
% Change over 2004 |
|||
|
STATS REGIONS |
MONTH |
YTD |
Rolling YEAR-END |
|
TOTAL FREIGHT |
|||
|
AFR |
2.4 |
-9.5 |
-2.0 |
|
ASP |
4.9 |
5.1 |
12.5 |
|
EUR |
-1.7 |
1.6 |
8.0 |
|
LAC |
4.8 |
7.0 |
11.2 |
|
MEA |
10.8 |
13.5 |
13.1 |
|
NAM |
0.7 |
-0.5 |
4.6 |
|
ACI |
2.4 |
2.7 |
8.7 |
|
|
|||
|
INTERNATIONAL FREIGHT |
|||
|
ACI |
2.6 |
4.5 |
11.5 |
|
|
|||
|
DOMESTIC FREIGHT |
|||
|
ACI |
3.3 |
0.0 |
4.5 |
|
Total: International + Domestic freight (when breakdown is available), some airports report Total only |
|||
|
International: Traffic (loaded + unloaded freight) performed between the designated airport and an airport in another country/territory |
|||
|
Domestic: Traffic (loaded and unloaded freight) performed between two airports located in the same country/territory |
|||
Note: PaxFlash and FreightFlash statistics are based on a significant sample of airports, which provide regular monthly reports to ACI, representing approximately 60% of total passenger figures and 70% of total freight worldwide.

Theodore is the Co-Founder and Managing Editor of TravelDailyNews Media Network; his responsibilities include business development and planning for TravelDailyNews long-term opportunities.