


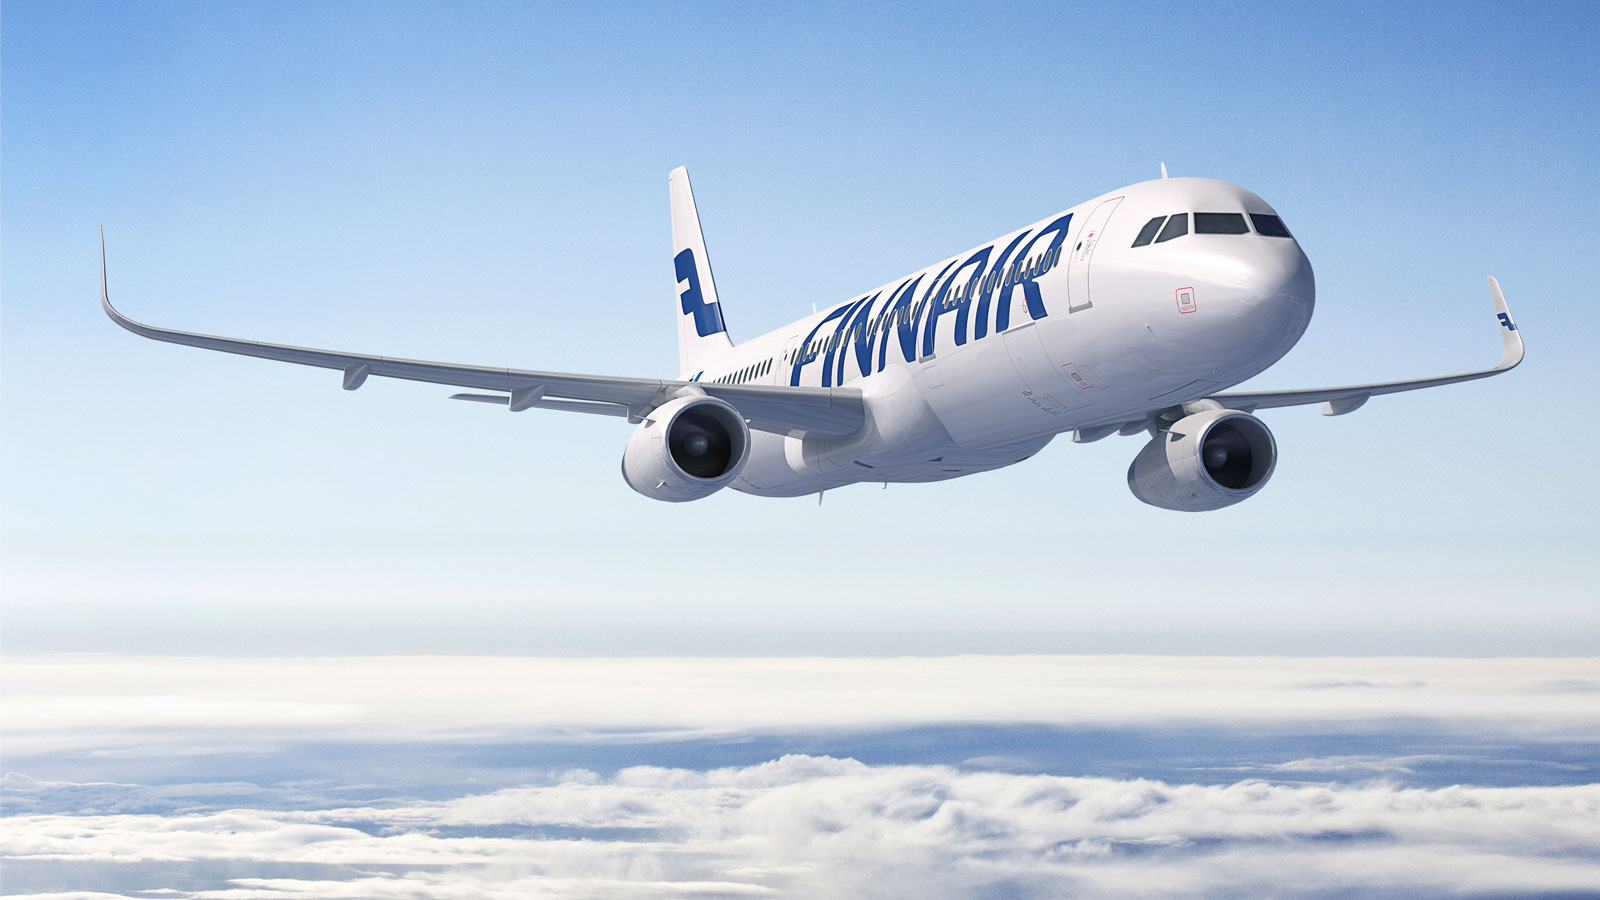

Year-on-year, passenger traffic figures declined.
In March, Finnair carried 918,900 passengers. This was 3.6% less than in March 2023. The overall capacity, measured in Available Seat Kilometres (ASK), increased in March by 3.9% year-on-year. If wet lease outs are included, capacity increased by 2.8%. Finnair’s traffic, measured in Revenue Passenger Kilometres (RPKs), increased by 0.3%. The Passenger Load Factor (PLF) declined by 2.7% points to 75.0%. The distance-based reported traffic figures do not take into account longer routings caused by the airspace closure as they are based on Great-Circle distance in accordance with the industry practice.
The ASK increase in Asian traffic was 13.5% year-on-year explained e.g. by the additional capacity to Japan and South Korea. The North Atlantic capacity decreased by 11.6%. In European traffic, the ASKs were up by 2.1%. The Middle Eastern capacity declined by 7.3% mainly due to cancelled flights to Israel. The ASKs in domestic traffic increased by 4.9%.
RPKs increased in Asian traffic by 6.9% year-on-year but decreased in North Atlantic traffic by 7.2%. They decreased by 1.4% in European traffic, by 9.3% in Middle Eastern traffic and by 1.8% in domestic traffic.
In March, the PLF was 73.6% in Asian traffic, 72.1% in North Atlantic traffic, 78.5% in European traffic, 72.5% in Middle Eastern traffic and 72.5% in domestic traffic.
Passenger numbers decreased year-on-year in Asian traffic by 3.5%, by 17.9% in North Atlantic traffic, by 0.5% in European traffic, by 11.7% in Middle Eastern traffic and by 7.3% in domestic traffic.
In March, 83.7% of all Finnair flights arrived on schedule (84.6%).
Traffic statistics for April 2024 will be published on Tuesday 7 May 2024.
| Finnair Traffic Performance March 2024 | ||||
| Month | % Change | YTD | % Change | |
| Total traffic | ||||
| Passengers 1,000 | 918.9 | – 3.6 | 2,543.4 | – 1.9 |
| Available seat kilometres mill | 3,106.0 | 3.9 | 8,922.9 | 4.4 |
| Revenue passenger kilometres mill | 2,328.9 | 0.3 | 6,435.2 | 0.3 |
| Passenger load factor % | 75.0 | – 2.7p | 72.1 | – 2.9p |
| Cargo tonnes total | 12,294.7 | 8.6 | 34,310.9 | 11.9 |
| Available tonne kilometres mill | 455.5 | 6.0 | 1,317.7 | 7.8 |
| Revenue tonne kilometres mill | 282.8 | 2.5 | 784.9 | 3.1 |
| Available seat kilometres incl. wet lease out mill | 3,315.4 | 2.8 | 9,540.4 | 3.5 |
| Asia | ||||
| Passengers 1,000 | 108.5 | – 3.5 | 318.5 | – 1.0 |
| Available seat kilometres mill | 1,237.4 | 13.5 | 3,552.8 | 12.5 |
| Revenue passenger kilometres mill | 910.1 | 6.9 | 2,516.8 | 4.1 |
| Passenger load factor % | 73.6 | – 4.6p | 70.8 | – 5.7p |
| Europe | ||||
| Passengers 1,000 | 537.8 | – 0.5 | 1,452.5 | 0.5 |
| Available seat kilometres mill | 1,099.1 | 2.1 | 3,154.5 | 3.9 |
| Revenue passenger kilometres mill | 862.3 | – 1.4 | 2,343.1 | – 0.1 |
| Passenger load factor % | 78.5 | – 2.8p | 74.3 | – 3.0p |
| North Atlantic | ||||
| Passengers 1,000 | 25.8 | – 17.9 | 73.1 | – 10.8 |
| Available seat kilometres mill | 313.6 | – 11.6 | 888.4 | – 9.5 |
| Revenue passenger kilometres mill | 226.0 | – 7.2 | 594.3 | – 6.7 |
| Passenger load factor % | 72.1 | 3.4p | 66.9 | 2.0p |
| Middle East | ||||
| Passengers 1,000 | 42.0 | – 11.7 | 131.1 | – 7.0 |
| Available seat kilometres mill | 262.5 | – 7.3 | 771.5 | – 7.0 |
| Revenue passenger kilometres mill | 190.3 | – 9.3 | 594.7 | – 4.9 |
| Passenger load factor % | 72.5 | – 1.6p | 77.1 | 1.7p |
| Domestic | ||||
| Passengers 1,000 | 204.9 | – 7.3 | 568.2 | – 5.7 |
| Available seat kilometres mill | 193.5 | 4.9 | 555.7 | 2.1 |
| Revenue passenger kilometres mill | 140.2 | – 1.8 | 386.3 | – 1.6 |
| Passenger load factor % | 72.5 | – 5.0p | 69.5 | – 2.6p |
| Cargo traffic | ||||
| – Europe tonnes | 2,188.9 | 26.8 | 5,894.8 | 35.9 |
| – North Atlantic tonnes | 1,053.8 | – 22.7 | 3,079.0 | – 20.9 |
| – Middle East tonnes | 2,221.5 | 5.0 | 5,965.3 | 1.1 |
| – Asia tonnes | 6,760.6 | 12.6 | 19,187.2 | 17.6 |
| – Domestic tonnes | 20.0 | – 42.1 | 63.1 | – 35.5 |
| – Cargo flights tonnes* | 49.9 | – 37.1 | 121.5 | 13.9 |
| Cargo traffic tonnes total | 12,294.7 | 8.6 | 34,310.9 | 11.9 |
| Revenue cargo tonne kilometres mill | 74.6 | 9.2 | 209.6 | 11.6 |
* Including purchased traffic
- Change %: Change compared to the figures of the respective periods in the previous year (p = points, N/A = not available).
- Available seat kilometres. ASK: Total number of seats available multiplied by kilometres flown.
- Revenue passenger kilometres. RPK: Number of revenue passengers carried multiplied by kilometres flown.
- Passenger load factor: Share of revenue passenger kilometres of available seat kilometres.
- Available tonne kilometres. ATK: Number of tonnes of capacity for carriage of passengers, cargo and mail multiplied by kilometres flown.
- Revenue tonne kilometres. RTK: Total revenue load consisting of passengers, cargo and mail multiplied by kilometres flown.

Vicky is the co-founder of TravelDailyNews Media Network where she is the Editor-in Chief. She is also responsible for the daily operation and the financial policy. She holds a Bachelor's degree in Tourism Business Administration from the Technical University of Athens and a Master in Business Administration (MBA) from the University of Wales.
She has many years of both academic and industrial experience within the travel industry. She has written/edited numerous articles in various tourism magazines.