


U.S. airlines carried 5.5 percent more domestic passengers and flew 0.7 percent more domestic flights during the first four months of…
U.S. airlines carried 5.5 percent more domestic passengers and flew 0.7 percent more domestic flights during the first four months of 2005 than they did during the same period in 2004, the U.S. Department of Transportation`s Bureau of Transportation Statistics (BTS) reported, in a release of preliminary data (Table 1).
BTS, a part of DOT`s Research and Innovative Technology Administration, reported that the airlines carried 209.0 million domestic passengers during the first four months of 2005, up from the 198.0 million carried between January and April 2004 (Table 2). The passengers were carried on 3.25 million flights, up 0.7 percent from the 3.23 million flights operated in 2004 (Table 1).
In other domestic comparisons from the first four months of 2004 to the first four months of 2005:
- Revenue passenger miles, a measure of the number of passengers and the distance flown, were up 5.6 percent.
- Available seat-miles, a measure of airline capacity, were up 1.2 percent.
- Passenger load factor, passengers carried as a proportion of available seats, was up 3.1 percentage points.
- Flight stage length, the average non-stop distance flown per departure, was up 1.7 percent.
- Passenger trip length, the average distance flown per passenger, was up 0.1 percent at 864 miles per trip.
Among airlines, Southwest Airlines carried 26.9 million domestic passengers during the first four months of 2005, the most of any airline (Table 3).
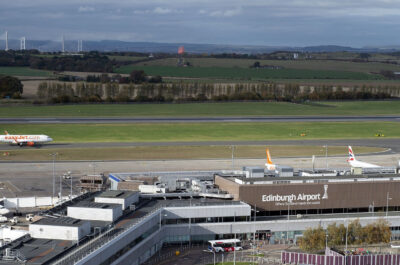
Among airports, Hartsfield-Jackson International in Atlanta was the busiest U.S. airport for domestic travel during the first four months of 2005, with 12.7 million passenger boardings (Table 4).
For the month of April 2005, U.S. airlines carried 54.7 million domestic passengers, 1.9 percent more than in April 2004 (Table 5).
These passengers were carried on 815,292 flights, down 1.3 percent from the flights operated in April 2004.
In other month-to-month domestic comparisons from April 2004 to April 2005:
Among airlines, Southwest Airlines carried 7.1 million domestic passengers during April, the most of any airline (Table 6).
Among airports, Hartsfield-Jackson International in Atlanta was the busiest U.S. airport for domestic travel during April, with 3.4 million passenger boardings (Table 7).
Data are compiled from monthly reports filed with BTS by commercial air carriers detailing operations, passenger traffic and freight traffic. March traffic data are preliminary and include data received by BTS from 128 airlines as of July 12. Data are subject to revision. Revised data from March 2005 and previous months are posted on the BTS website.

Source: Bureau of Transportation Statistics, T-100 Domestic Market and Segment
* The average non-stop distance flown per departure in miles
** The average distance flown per passenger in miles

Source: Bureau of Transportation Statistics, T-100 Domestic Market

Source: Bureau of Transportation Statistics, T-100 Domestic Market

Source: Bureau of Transportation Statistics, T-100 Domestic Market

Source: Bureau of Transportation Statistics, T-100 Domestic Market and Segment
* The average non-stop distance flown per departure in miles
** The average distance flown per passenger in miles

Source: Bureau of Transportation Statistics, T-100 Domestic Market

Source: Bureau of Transportation Statistics, T-100 Domestic Market

Theodore is the Co-Founder and Managing Editor of TravelDailyNews Media Network; his responsibilities include business development and planning for TravelDailyNews long-term opportunities.