


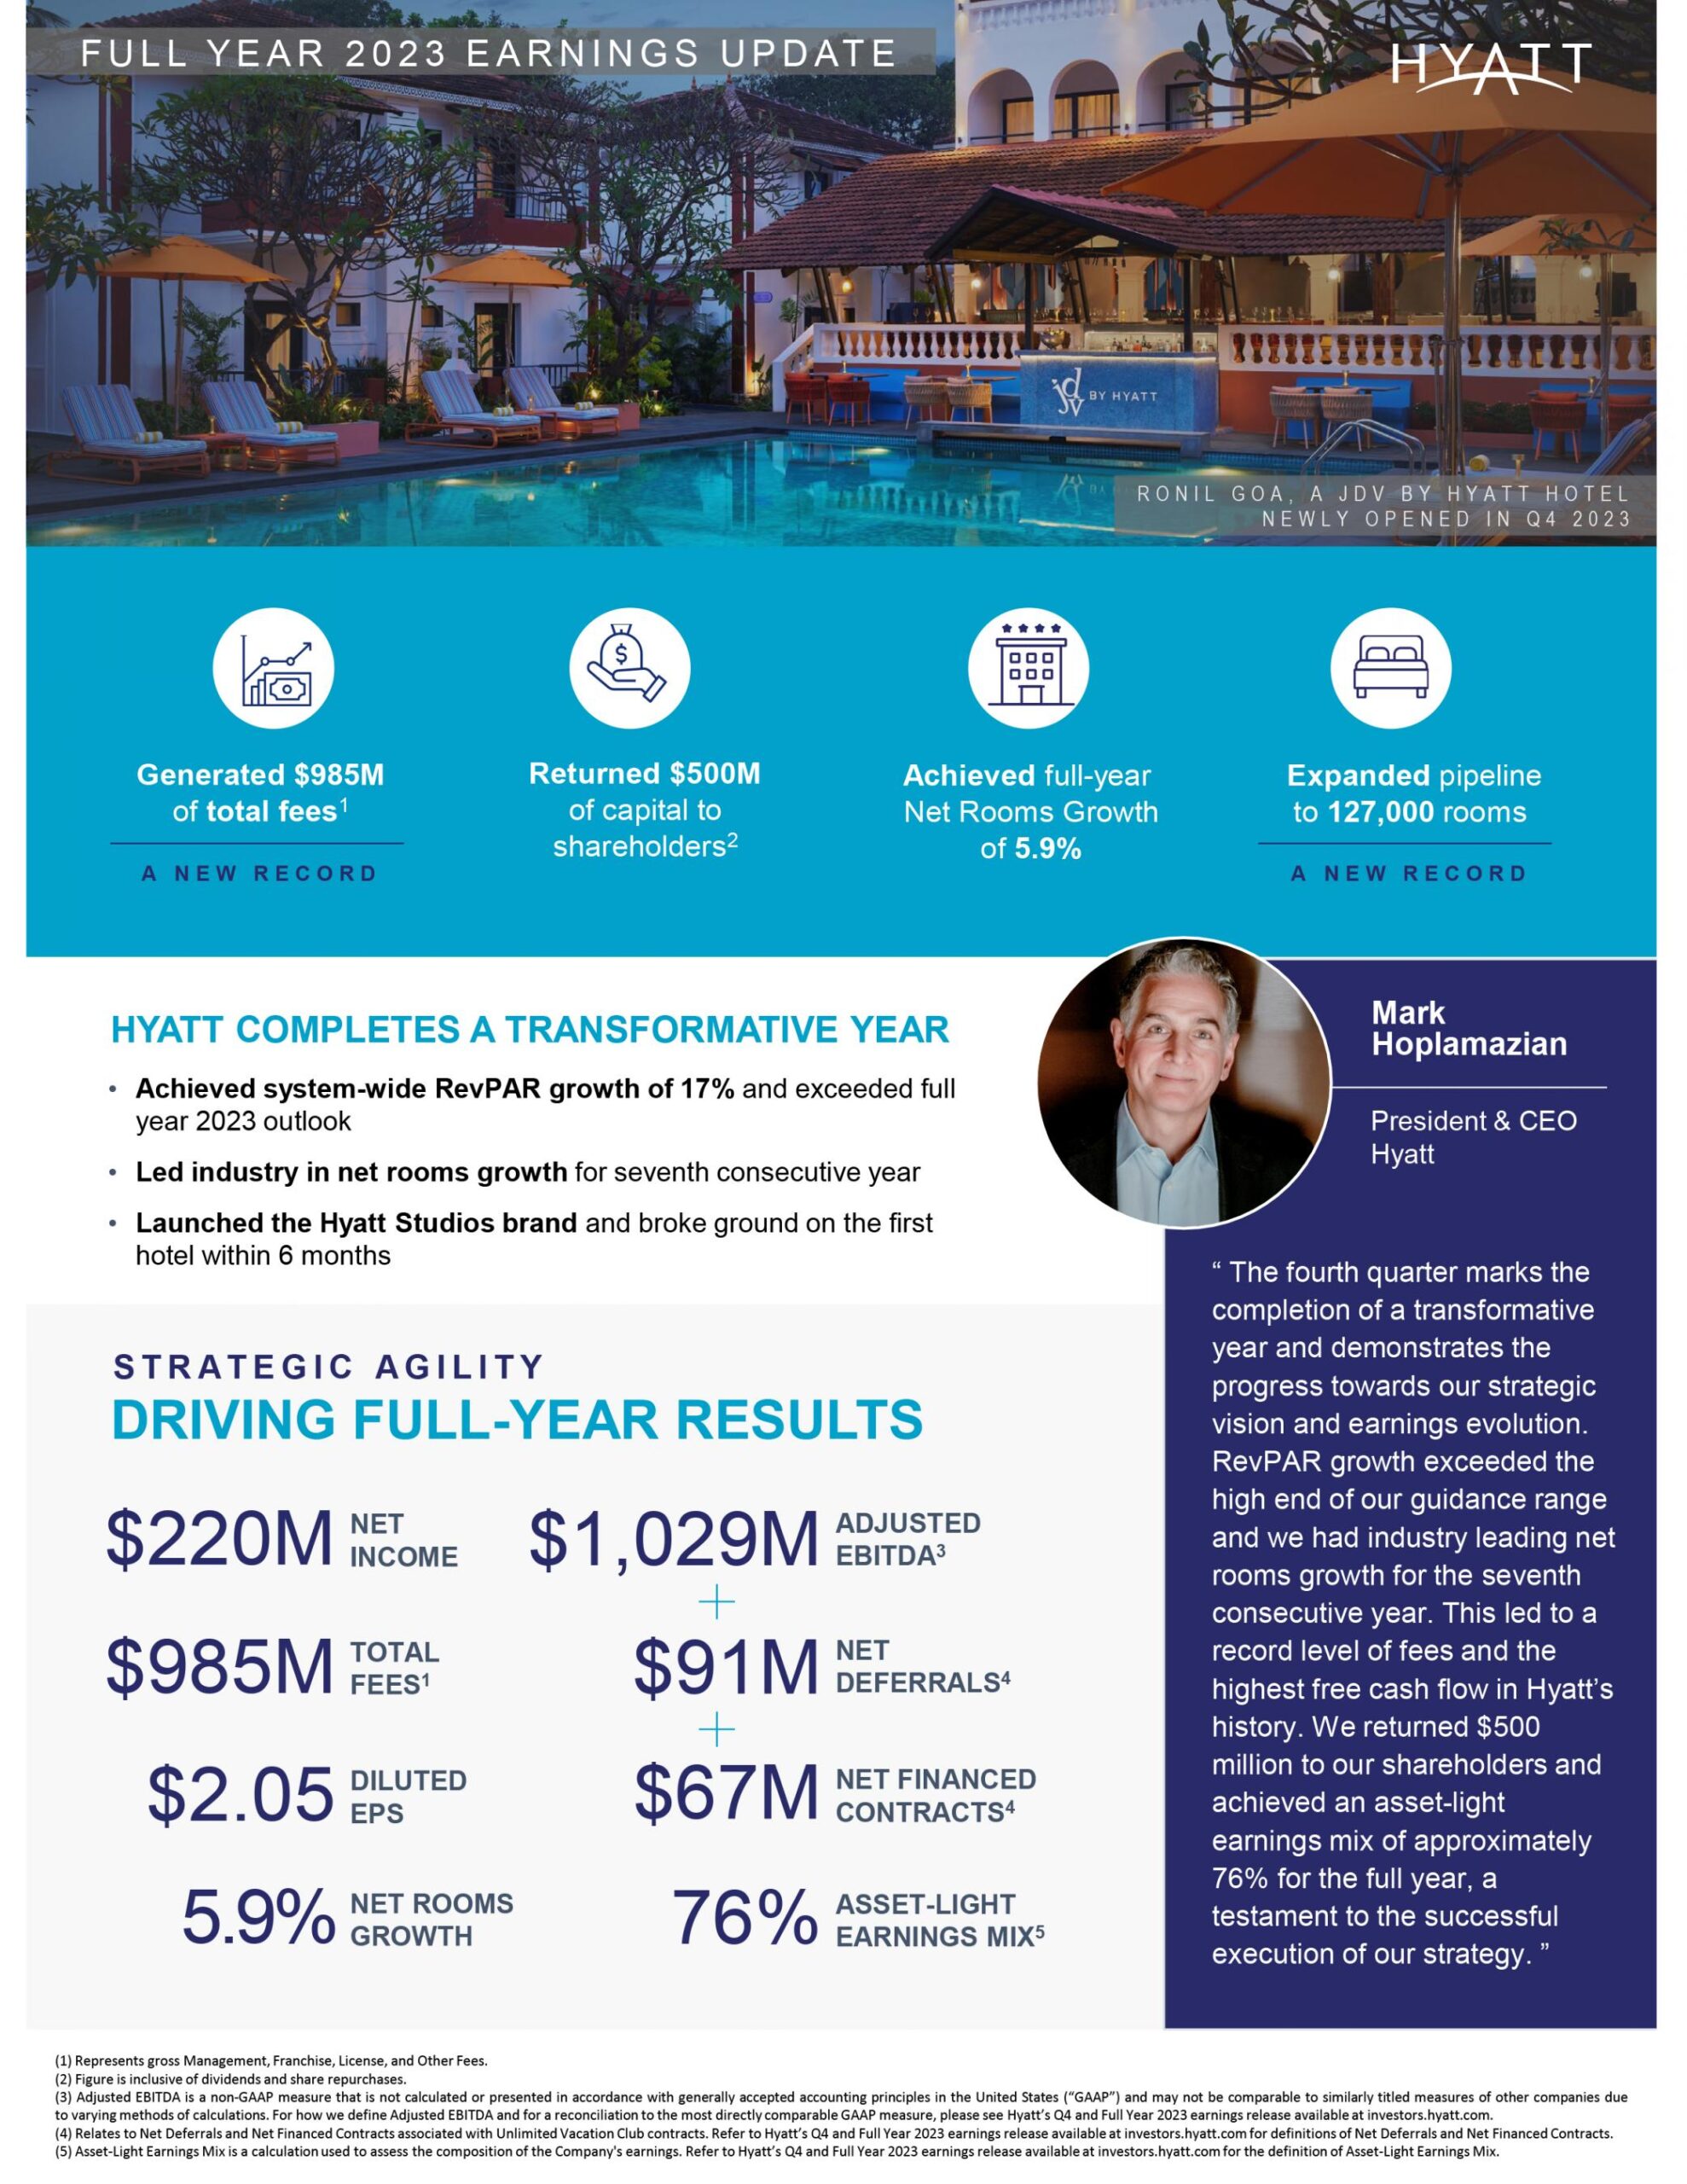
Record total fee revenue led to the highest cash flow from operations in company history, full year system-wide RevPAR increased 17%.
CHICAGO – Hyatt Hotels Corporation reported fourth quarter and full year 2023 financial results. Highlights include:
- Net income was $26 million in the fourth quarter and $220 million for the full year of 2023, and exceeded the full year outlook for 2023. Adjusted net income was $68 million in the fourth quarter and $276 million for the full year of 2023.
- Diluted EPS was $0.25 in the fourth quarter and $2.05 for the full year of 2023. Adjusted Diluted EPS was $0.64 in the fourth quarter and $2.56 for the full year of 2023.
- Adjusted EBITDA was $241 million in the fourth quarter and $1,029 million for the full year of 2023, and exceeded the full year outlook range for 2023.
- Adjusted EBITDA does not include Net Deferrals and Net Financed Contracts of $33 million1 in the fourth quarter or Net Deferrals and Net Financed Contracts of $158 million* for the full year of 2023.
- Comparable system-wide RevPAR increased 9.1% in the fourth quarter and 17.0% for the full year of 2023, compared to the same periods in 2022, and exceeded the full year outlook for 2023.
- Comparable owned and leased hotels RevPAR increased 5.9% in the fourth quarter and 15.5% for the full year of 2023, compared to the same periods in 2022. Comparable owned and leased hotels operating margin was 26.2% in the fourth quarter and 25.4% for the full year of 2023.
- Comparable Net Package RevPAR increased 11.3% in the fourth quarter and 15.3% for the full year of 2023 compared to the same periods in 2022.
- Net Rooms Growth was 5.9% for the full year of 2023, in line with the full year outlook for 2023.
- Pipeline of executed management or franchise contracts was approximately 127,000 rooms.
- Share Repurchases were approximately 890 thousand Class A shares for $95 million in the fourth quarter and approximately 4.1 million Class A shares for $453 million for the full year of 2023.
- Capital Returns to Shareholders were $500 million for the full year of 2023, inclusive of dividends and share repurchases, in line with the full year outlook for 2023.
Mark S. Hoplamazian, President and Chief Executive Officer of Hyatt, said, “The fourth quarter marks the completion of a transformative year and demonstrates the progress towards our strategic vision and earnings evolution. RevPAR growth exceeded the high end of our guidance range and we had industry leading net rooms growth for the seventh consecutive year. This led to a record level of fees and the highest free cash flow in Hyatt’s history. We returned $500 million to our shareholders and achieved an asset-light earnings mix of approximately 76% for the full year, a testament to the successful execution of our strategy.”
Operational Update
A record level of management, franchise, license, and other fees of $256 million were generated in the fourth quarter of 2023 driven by continued strong global demand for travel and net rooms growth.
Comparable system-wide RevPAR increased 9.1% in the fourth quarter and increased 17.0% for the full year of 2023, compared to the same periods in 2022, driven by the rapid recovery in Greater China and strengthening group demand in the United States. Group booking pace for Americas full service managed properties is currently up 8% for full year 2024 compared to 2023.
Comparable Net Package RevPAR for ALG properties increased 9.2% in the fourth quarter and 13.6% for the full year of 2023, compared to the same periods in 2022. The fourth quarter benefited from improved results in Cancun, with Comparable Net Package RevPAR up approximately 10% compared to the same period in 2022. In the first quarter of 2024, booking pace for ALG all-inclusive properties in the Americas is up 11% for the first quarter of 2024.
Segment Results and Highlights
| (in millions) |
Three Months Ended December 31, |
Year Ended December 31, |
|||||||||
|
2023 |
2022 |
|
Change (%) |
2023 |
2022 |
Change (%) |
|||||
| Owned and leased hotels |
$ 90 |
$ 88 |
3.0 % |
$ 312 |
$ 307 |
1.7 % |
|||||
| Americas management and franchising |
114 |
106 |
7.6 % |
469 |
422 |
11.2 % |
|||||
| ASPAC management and franchising (a) |
36 |
20 |
|
76.9 % |
126 |
54 |
131.9 % |
||||
| EAME management and franchising (a) |
17 |
15 |
19.7 % |
61 |
47 |
30.4 % |
|||||
| Apple Leisure Group |
21 |
43 |
|
(52.8) % |
199 |
231 |
(14.0) % |
||||
| Corporate and other |
(37) |
(40) |
6.6 % |
(139) |
(154) |
9.9 % |
|||||
| Eliminations |
— |
— |
|
772.6 % |
1 |
1 |
33.1 % |
||||
| Adjusted EBITDA |
$ 241 |
$ 232 |
|
4.0 % |
$ 1,029 |
$ 908 |
13.4 % |
||||
|
Three Months Ended December 31, |
Year Ended December 31, |
||||||||||
|
2023 |
2022 |
Change (%) |
2023 |
2022 |
Change (%) |
||||||
| Net Deferrals |
$ 18 |
$ 28 |
(37.2) % |
$ 91 |
$ 94 |
(3.4) % |
|||||
| Net Financed Contracts |
$ 15 |
$ 15 |
1.7 % |
$ 67 |
$ 63 |
6.9 % |
|||||
(a) Effective January 1, 2023, the Company has changed the strategic and operational oversight for our properties located in the Indian subcontinent. Revenues associated with these properties are now reported in the ASPAC management and franchising segment. The segment changes have been reflected retrospectively for the three months and year ended December 31, 2022.
- Owned and leased hotels segment: Results in the fourth quarter were driven by the recovery of group demand and increased rate growth across group and transient customers which contributed to strong RevPAR growth over the fourth quarter of 2022. Comparable owned and leased hotels operating margin expanded 240 basis points compared to the fourth quarter of 2019 and 310 basis points compared to the full year of 2019.
- Americas management and franchising segment: Results in the fourth quarter were driven by improved group and business transient results along with resilient leisure demand. Total fees in the quarter increased 6% compared to the fourth quarter of 2022, with RevPAR in the United States up 3% in the fourth quarter compared to the same period in 2022, driven by strong group rate.
- ASPAC management and franchising segment: Results in the fourth quarter were driven by strength in all customer segments which contributed to RevPAR growth across the sub regions, with Greater China improving 84% compared to the fourth quarter of 2022.
- EAME management and franchising segment: Results in the fourth quarter were driven by resilient leisure demand and strong business transient and group performance, despite the impact of the 2022 World Cup in Qatar. The region benefited from increased airlift from the United States, Middle East, and China.
- Apple Leisure Group segment: Results in the fourth quarter benefited from improved results in Cancun. ALG segment Adjusted EBITDA for the quarter increased 33% when adjusted for the $23 million non-cash benefit in the fourth quarter of 2022, that did not repeat in 2023, and the unfavorable impact of foreign currency exchange rates from the strengthening Mexican Peso.
Openings and Development
In the fourth quarter, 29 new hotels (or 9,648 rooms) joined Hyatt’s portfolio, inclusive of six hotels in Greater China that converted to a Hyatt brand through a strategic relationship with an affiliate of Mumian Hotels. Notable openings included the 2,500 room Rio Hotel & Casino in Las Vegas, Nevada, and the 1,100 room Sunscape Coco Punta Cana and 900 room Sunscape Dominicus La Romana in the Dominican Republic. Hotel Toranomon Hills, part of The Unbound Collection by Hyatt, in Japan, and Ronil Goa, a JdV by Hyatt hotel, in India, also opened during the quarter.
For the full year of 2023, 101 new hotels (or 23,965 rooms) joined Hyatt’s portfolio, inclusive of 43 hotels (or 13,223 rooms) which converted to a Hyatt brand.
As of December 31, 2023, the Company had a pipeline of executed management or franchise contracts for approximately 650 hotels (approximately 127,000 rooms), inclusive of 17 Hyatt Studios hotels (approximately 2,000 rooms). During the fourth quarter, the first Hyatt Studios hotel broke ground in Mobile, Alabama.
2024 Outlook
The Company is providing the following outlook for the 2024 fiscal year. Please refer to the table on schedule A-22 which bridges 2023 full year reported actual results to illustrative 2023 results that adjust for the sale of Hyatt Regency Aruba Resort Spa and Casino, the Unlimited Vacation Club transaction, and the reporting of Mr & Mrs Smith commissions and SG&A in the Distribution segment within distribution revenues and distribution expenses, in connection with the segment realignment.
|
Full Year 2024 vs. 2023 |
||
| System-Wide RevPAR1 |
3% to 5% |
|
| Net Rooms Growth |
5.5% to 6% |
|
| (in millions) |
Full Year 2024 |
|
| Net Income |
Approx. $560 |
|
| Management, Franchise, License, and Other Fees |
$1,100 – $1,130 |
|
| Adjusted SG&A2, 3 |
$425 – $435 |
|
| Adjusted EBITDA2 |
$1,175 – $1,225 |
|
| Net Deferrals + Net Financed Contracts |
N/A – Refer to Transactions and Capital Strategy section of the Earnings Release |
|
| Capital Expenditures |
Approx. $170 |
|
| Free Cash Flow2 |
$625 – $675 |
|
| Capital Returns to Shareholders4 |
$550 – $600 |
* Represents the sum of Net Deferrals and Net Financed Contracts. Refer to Apple Leisure Group Segment Statistics on schedule A-18 for additional details.
1 RevPAR is based on constant currency whereby previous periods are translated based on the current period exchange rate. RevPAR percentage for 2024 vs. 2023 is based on comparable hotels.
2 Refer to the tables beginning with schedule A-15 for a reconciliation of estimated net income attributable to Hyatt Hotels Corporation to EBITDA and EBITDA to Adjusted EBITDA, selling, general, and administrative expenses to Adjusted selling, general, and administrative expenses, and net cash provided by operating activities to Free Cash Flow.
3 Adjusted SG&A outlook excludes integration related expenses.
4 The Company expects to return capital to shareholders through a combination of cash dividends on its common stock and share repurchases.

Vicky is the co-founder of TravelDailyNews Media Network where she is the Editor-in Chief. She is also responsible for the daily operation and the financial policy. She holds a Bachelor's degree in Tourism Business Administration from the Technical University of Athens and a Master in Business Administration (MBA) from the University of Wales.
She has many years of both academic and industrial experience within the travel industry. She has written/edited numerous articles in various tourism magazines.