


Both the luxury and midscale and economy segments exhibited the greatest year-on-year margin declines
Hotels in the United States saw general pressure on profit margins in the first half of 2023, with Gross Operating Profit (GOP) margin falling by 1 percentage point compared to the same period in 2022. A closer look at brand-scale performance according to HotStats, reveals that the extremes were particularly affected: both the luxury and midscale and economy segments exhibited the greatest year-on-year margin declines, as shown in Figure 1.
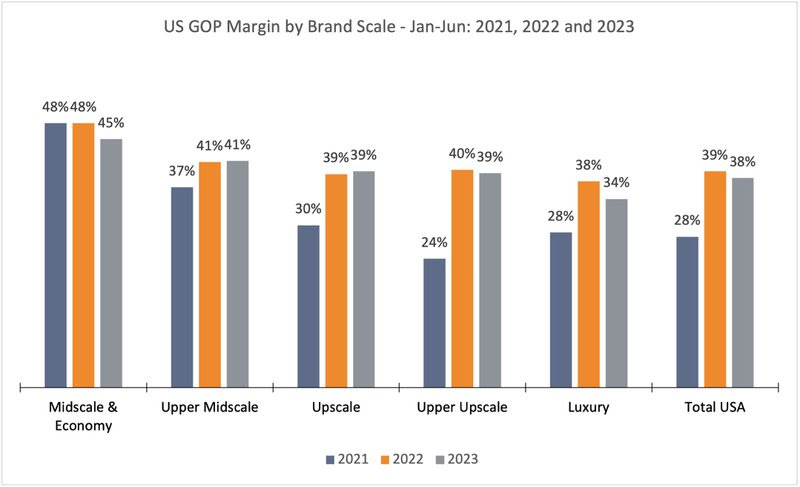
Figure 1 US GOP as a % of Total Revenue, H1 2021, 2022 and 2023
A major factor influencing this trend is the increase in labor costs. At a time when many hotels face continued labor shortages, the reliance in overtime and contract labor, as well as the need to offer more attractive wages and benefits to compete with other industries for talent, has resulted in a significant expansion in this expense category. So much so, that across asset classes and in the total United States, total labor costs have outpaced total revenue year-over-year increases on a per available room basis.
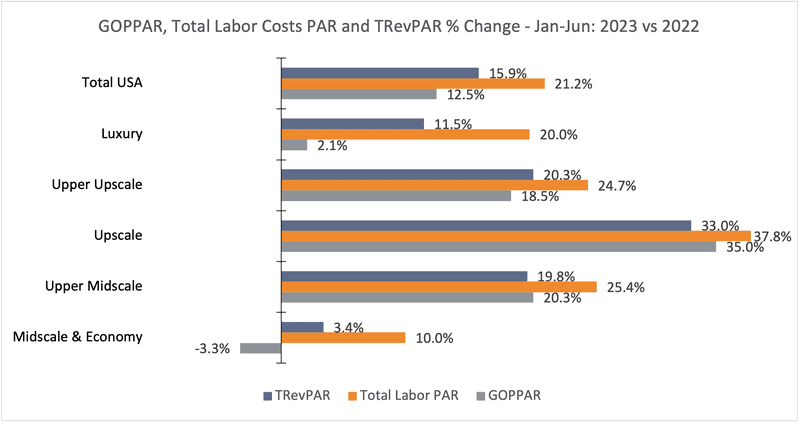
Figure 2 YOY % Change: GOPPAR, Total Labor Costs PAR and TRevPAR
The extremes of the brand scale again bore the brunt of this disparity: the luxury segment saw labor costs per available room outpace TRevPAR growth by 5.3 percentage points, while midscale and economy properties had a 6.6 percentage-point gap. This had significant implications on the achieved GOP per available room, with a 2.1% year-on-year uptick in luxury and a 3.3% decline in midscale and economy.
To further understand the evolution of margins in the United States, we created a two-dimensional graph using state-level data for New York (NY), Pennsylvania (PA), Massachusetts (MA), California (CA), Texas (TX), Illinois (IL), Florida (FL), Georgia (GA), Ohio (OH), Louisiana (LA), Arizona (AZ), Hawaii (HI) and Washington (WA). We also included the country total (USA) for context.
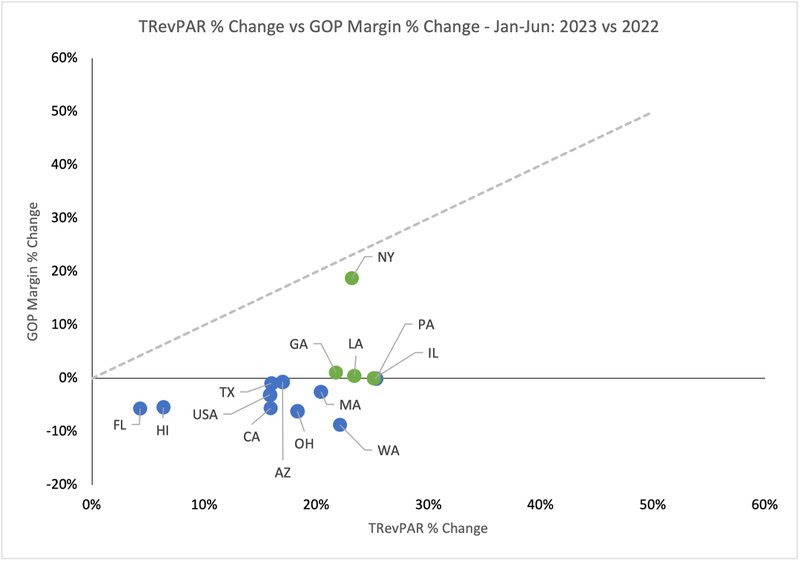
Figure 3 TRevPAR % Change vs GOP Margin % Change: H1 2023 vs 2022
The first dimension in the graph is the year-over-year percentage change in TRevPAR, which we measure on the horizontal x-axis. On the vertical y-axis, we measure our second dimension, year-over-year percentage change in GOP margin. The idea is to understand not only how these two performance indicators changed as compared to the first half of 2022, but also what is the interaction between them.
The x-axis in Figure 3 shows that all the states in the sample as well as the USA placed to the right of zero, meaning that they all achieved a greater TRevPAR in January through June of 2023 than they did in the same period of last year. However, the story is more nuanced when looking at the y-axis: only 5 states in the sample placed at or above zero, which means that the remaining 8 and the whole USA experienced a margin decline in 2023 compared to 2022 despite the top-line growth. This is evidence of a flow-through deterioration in these markets, as they are retaining smaller portions of the increased revenue.
It is evident that GOP margins can’t grow indefinitely, but it does raise concerns over cost creep when markets can’t sustain the GOP% they managed to achieve in past periods notwithstanding revenue growth. Of particular interest are the states of Washington, Ohio, California, Florida and Hawaii, because they have the greatest margin decreases of the sample, ranging from 5 to 9 percent below 2022 levels. On the flip side, the state of New York experienced the greatest margin increase in the sample, a 19-percent jump over 2022.
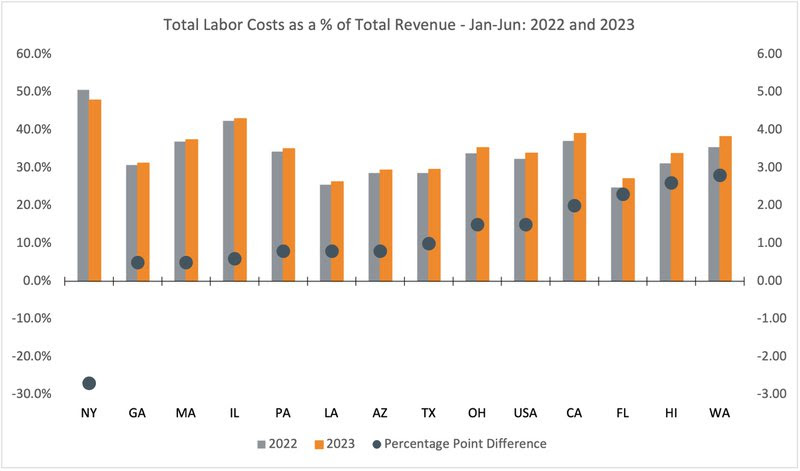
Figure 4 Total Labor Costs as a % of Total Revenue and Percentage Point difference: H1 2023 vs 2022
Figure 4 shows total labor costs as a percentage of total revenue for the first half of 2022 and 2023, as well as the percentage point difference between the two time periods. It is no surprise to find that the same states with the deepest margin falls are the ones that experienced the highest percentage-point labor cost increases, while the state of New York is the only one that recorded a percentage-point fall.
The fact that hotel total revenue continues to grow is positive. However, it is important to keep in mind that revenue is not a synonym for profitability. As volume expands and the recovery of the different guest segments progresses, cost controls become ever more important to protect flow-through and optimize profit conversion.

Tatiana is the news coordinator for TravelDailyNews Media Network (traveldailynews.gr, traveldailynews.com and traveldailynews.asia). Her role includes monitoring the hundreds of news sources of TravelDailyNews Media Network and skimming the most important according to our strategy.
She holds a Bachelor's degree in Communication & Mass Media from Panteion University of Political & Social Studies of Athens and she has been editor and editor-in-chief in various economic magazines and newspapers.