


The flown load factor for January was 70 percent.
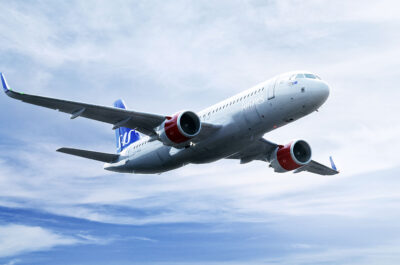
A;most 1.5 million passengers traveled with SAS in January, a 1 percent increase compared with the same month last year. SAS’ capacity increased by 5 percent and RPK increased by 9 percent, compared with January 2023.
“We are pleased to see that more and more people choose to travel with SAS. To meet the increasing demand for travel, we released our summer program in January, adding several new and exciting destinations in Scandinavia, Europe and the US. We also announced a new collaboration with Airbus, Swedavia, Vattenfall and Avinor, to jointly investigate the feasibility of infrastructure for hydrogen-fueled aircraft at airports in Norway and Sweden. By partnering with some of the strongest players in the industry, we are assuming our role in driving the transition towards achieving net-zero emissions,” says Anko van der Werff, President & CEO of SAS.
| SAS total traffic (scheduled and charter) | Jan24 | Change1 | Nov23- Jan24 | Change 1 |
| ASK (Mill.) | 2,832 | 4.7% | 9,124 | 9.3% |
| RPK (Mill.) | 1,982 | 8.6% | 6,552 | 13.3% |
| Load factor | 70.0% | 2.5 pp | 71.8% | 2.6 pp |
| No. of passengers (000) | 1,450 | 1.4% | 4,853 | 6.3% |
1 Change compared to same period last year, pp = percentage points
| Geographical development, schedule | Jan24 vs. Jan23 | Nov23-Jan24 vs. Nov22-Jan23 | ||
| RPK | ASK | RPK | ASK | |
| Intercontinental | 16.2% | 13.4% | 17.3% | 13.7% |
| Europe/Intra-Scandinavia | 7.3% | 1.7% | 16.8% | 11.9% |
| Domestic | -3.0% | -6.9% | -0.2% | -5.4% |
| Preliminary yield and PASK | Jan24 | Nominal change1 | FX adjusted change |
| Yield, SEK | 1.03 | -1.1% | 1.8% |
| PASK, SEK | 0.71 | 2.9% | 5.9% |
| Jan24 | |||
| Punctuality (arrival 15 min) | 69.1% | ||
| Regularity | 97.6% | ||
| Change in total CO2 emissions | 19.8% | ||
| Change in CO2 emissions per available seat kilometer | 0.2% |
Definitions:
RPK – Revenue passenger kilometers
ASK – Available seat kilometers
Load factor – RPK/ASK
Yield – Passenger revenues/RPK (scheduled)
PASK – Passenger revenues/ASK (scheduled)
Change in CO2 emissions per available seat kilometers – SAS passenger related carbon emissions divided with total available seat kilometers (incl non-revenue and EuroBonus tickets), rolling 12 months vs rolling 12 months previous year

Theodore is the Co-Founder and Managing Editor of TravelDailyNews Media Network; his responsibilities include business development and planning for TravelDailyNews long-term opportunities.