


Full-service hotels grew house profit 1.4%, while limited-service properties saw a slight profit decline of 0.2% from levels achieved in 2016. Among the class segments, Luxury hotels achieved the greatest profit increase (+3.1%), while Upscale (-0.3%) and Upper Midscale (-0.3%) each reported a profit decline.
BROOMFIELD, COLORADO – Results from STR’s 2018 HOST Almanac indicate that U.S. hotel industry revenues topped an estimated $208 billion in 2017, which was an increase of $10 billion from 2016. The total revenue figure and a total industrywide house profit of $77 billion were each all-time highs for the industry.
STR’s HOST (Hotel Operating Statistics) P&L program compiles data from more than 9,000 hotels annually. Those properties comprise 1.9 million rooms globally.
Even though records were set in each category, STR’s Consulting & Analytics team notes that growth was much lower than the levels experienced in 2015. House profit increased 4.0% compared with 11.1% in 2015. Total revenues increased 4.5% in 2016 after rising 8.1% in 2015.
“The industry reached a milestone by exceeding $200 billion in total revenue last year,” said Joseph Rael, STR’s director of financial performance. “However, while revenue is still growing, expenses grew at a higher rate for the second year in a row. As a result, profit margins have declined somewhat.”
Same-Store Analysis
STR analyzed same-store growth rates for the more than 5,200 U.S. hotels that participated in the HOST program in both 2017 and 2016. Among those hotels, gross operating profits (GOP) increased 1.0% on 1.9% total revenue growth.
Full-service hotels grew house profit 1.4%, while limited-service properties saw a slight profit decline of 0.2% from levels achieved in 2016. Among the class segments, Luxury hotels achieved the greatest profit increase (+3.1%), while Upscale (-0.3%) and Upper Midscale (-0.3%) each reported a profit decline.
For the fourth year in a row, miscellaneous income led all revenue departments with 8.8% growth. According to Rael, this demonstrates the recent industrywide emphasis on fee-based income. Also in 2017, franchise fees, management fees and property taxes represented some of the largest expense increases, with all three above +4.0%. Utility expenses increased 1.3% after two consecutive years of declines. Total labor costs grew 3.2%, which was below the 4.0% growth levels of 2016 and 2015, but higher than revenue growth for the second straight year.
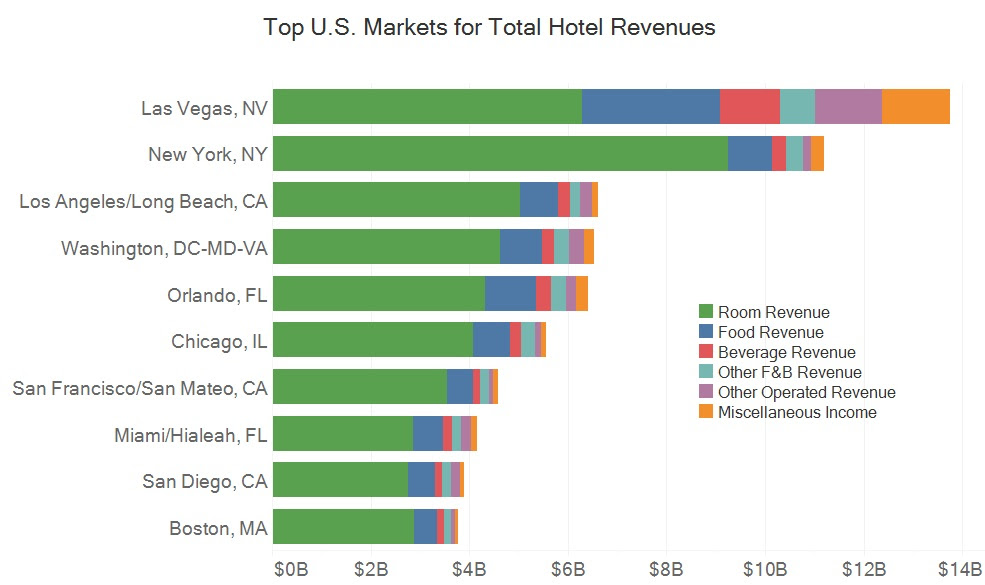
Top Markets
New to this year’s HOST program, STR developed a model for industry profitability that covered all U.S. hotels. This provided estimated industrywide departmental revenues and expenses as well as individual segments and markets. Based on the model, STR estimated total U.S. F&B revenues of $38 billion, other department revenues of $7 billion and miscellaneous income of $6 billion. Las Vegas led all markets with more than $13 billion in total revenue (excluding gaming), while New York City ranked second at $11 billion. Los Angeles, Washington, D.C. and Orlando rounded out the top five with total revenue all in excess of $6 billion.

Vicky is the co-founder of TravelDailyNews Media Network where she is the Editor-in Chief. She is also responsible for the daily operation and the financial policy. She holds a Bachelor's degree in Tourism Business Administration from the Technical University of Athens and a Master in Business Administration (MBA) from the University of Wales.
She has many years of both academic and industrial experience within the travel industry. She has written/edited numerous articles in various tourism magazines.