


The CarTrawler worldwide estimate of ancillary revenue forecasts 18.8% increase above 2014, with $36.7 billion of the total composed of a la carte fee activity. The CarTrawler Worldwide Estimate of Ancillary Revenue represents an increase of 163% from the 2010 figure of $22.6 billion, which was the first year for the ancillary revenue estimate.
DUBLI, IRELAND – IdeaWorksCompany, the foremost consultancy on airline ancillary revenues, and CarTrawler, a leading online car rental and ground transportation platform, project airline ancillary revenue will reach $59.2 billion worldwide in 2015. The CarTrawler Worldwide Estimate of Ancillary Revenue represents an increase of 163% from the 2010 figure of $22.6 billion, which was the first year for the ancillary revenue estimate.
Earlier this year, CarTrawler and IdeaWorksCompany reported the ancillary revenue disclosed by 63 airlines for 2014. These statistics were applied to a larger list of 180 airlines to provide a truly global projection of ancillary revenue activity by the world’s airlines in 2015. The CarTrawler Worldwide Estimate of Ancillary Revenue marks the sixth year IdeaWorksCompany has prepared a projection of global ancillary revenue activity.
“These figures show the impact that ancillary revenue has on the bottom lines of airlines, but it is also a critically important element of the customer experience,” says Michael Cunningham, Chief Commercial Officer at CarTrawler. “Airlines that offer a rounded, sophisticated customer experience by drawing on data science insights and the right ancillary offerings have a better chance of backing up revenues with increased loyalty and a stronger brand promise, which in turn leads to increased repeat bookings.”
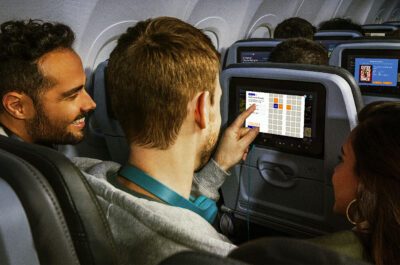
Revenue from optional services, such as onboard sales of food and beverages, checked baggage, premium seat assignments, and early boarding benefits, was determined to represent $36.7 billion of the projected global 2015 total. The smaller share, at $22.5 billion, comes from non-fee activity such as the sale of frequent flier miles to program partners, and commissions earned on the sale of services to travelers, such as hotel accommodations and car rentals.
|
Worldwide Estimate of Ancillary Revenue |
|||||
|
2015 Estimate $59.2 billion (7.8% of global revenue of $763 billion) |
2014 Estimate $49.9 billion (6.7% of global revenue of $746 billion) |
2013 Estimate $42.6 billion (6% of global revenue of $708 billion) |
2012 Estimate $36.1 billion (5.4% of global revenue of $667 billion) |
2011 Estimate $32.5 billion (5.6% of global revenue of $577 billion) |
2010 Estimate $22.6 billion (4.8% of global revenue of $474 billion) |
|
Source: Ancillary revenue statistics applied by IdeaWorksCompany to individual airline revenue results for the year indicated from Air Transport World, Airline Business, and at airline websites. |
|||||
“These figures show the impact that ancillary revenue has on the bottom lines of airlines, but it is also a critically important element of the customer experience,” says Michael Cunningham. “Airlines that offer a rounded, sophisticated customer experience by drawing on data science insights and the right ancillary offerings have a better chance of backing up revenues with increased loyalty and a stronger brand promise, which in turn leads to increased repeat bookings.”
Analysis performed by IdeaWorksCompany during the past six years reveals natural groupings (or categories) based upon a carrier’s ability to generate ancillary revenue.
The “percentage of revenue” results associated with four defined categories have been applied to a worldwide compilation of operating revenue disclosed by 180 airlines.
The following describes the four categories:
- Traditional Airlines. This category represents a catch-all for the largest number of carriers. Ancillary revenue activity may consist of fees associated with excess or heavy bags, extra legroom seating and partner activity for a frequent flier program. The average percentage of revenue increased to 4.1% from 3.6% last year. Examples in this category include Air China, Avianca, Etihad Airways, and SWISS.
- Major US Airlines. US-based majors generate strong ancillary revenue through a combination of frequent flier revenue and baggage fees. The percentage of revenue for this group jumped to 11.3% from 9.9% for 2014 due to better revenue management and agency distribution, and more financial disclosures. Examples include Alaska, Delta, and United.
- Ancillary Revenue Champs. These carriers generate the highest activity as a percentage of operating revenue. The percentage of revenue achieved by this group grew to 26.1% from 23.6% for 2014. Examples include Spirit Airlines, Tigerair, and WizzAir.
- Low Cost Carriers. LCCs throughout the world typically rely upon a mix of a la carte activity to generate good levels of ancillary revenue. The percentage of revenue for this group was 11.8%, which is slightly below last year’s 12.1%. The percentage dropped because a few better performing airlines were reclassified under the Champs category this year. Low cost carriers include Icelandair, Jazeera Airways, Jeju Air, and Spring Airlines.
for the year indicated from Air Transport World, Airline Business, and at airline websites
The US Major Airlines category produces a significant share of global ancillary revenue (see Graph 1). The $18.1 billion result (30.6% of the global total) is generated by just six carriers: Alaska Airlines, American, Delta, Hawaiian, Southwest, and United. These carriers rely upon their frequent flier programs to generate a significant share of ancillary revenue. For example, more than 62% of Delta’s ancillary revenue is produced by its SkyMiles frequent flier program.
The largest category at 33.8% is generated by carriers classified as Traditional Airlines. This group consists of 109 carriers out of the total 180 airline sample.
PINAKAS
Graph 2 displays the typical ancillary revenue sources for carriers such as American, Delta, and United. Baggage fees for US carriers represent approximately 20% of their ancillary receipts. The remaining revenue is produced by an array of a la carte and commission-based products. Other sources include onboard sales of food, beverages, Wifi, and commissions from
car rental bookings.
The a la carte category grew to 20% (from 15% for 2014) due to more emphasis placed upon comfort-related services such as premium economy seating, buy-on-board food, and priority screening and boarding. Alaska, American, Delta, Hawaiian, and United offer premium economy zones which provide more leg room and other features. For example, “Delta Comfort+” includes early boarding, front of cabin seating, extra legroom, better snacks, beer, wine and cocktails, and premium Wifi entertainment.
PINAKAS
The Traditional Airline Category (for carriers outside the US) is the largest piece of the pie at $20 billion. The revenue profile for these carriers (see Graph 3) is distributed across a variety of a la carte activities. Many are adopting baggage fees with significant activity occurring within Europe where low cost competition continues to climb. Air France, Austrian, British Airways, Finnair, KLM, Lufthansa, SWISS, and Scandinavian all have intra-Europe options which offer additional savings by excluding a checked bag. Travelers may include a bag by paying the a la carte fee or booking a fare bundle which includes baggage. IdeaWorksCompany believes the revenue potential of this trend will encourage adoption in other regions of the world such as Asia and South America
PINAKAS
The largest share of ancillary revenue growth for 2015 can be attributed to the improving results posted by the world’s airline industry with more passengers and revenue projected by IATA for the year. This represented 47% of the $9.3 billion in crease from 2014. Nearly 24% of the increase was generated by traditional airlines improving their ancillary revenue results, mostly through the addition of bag fees. As described earlier, US-based airlines also improved their results, and this was responsible for 21% of the 2015 increase.
PINAKAS
Regardless of the region, airlines all over the world rely now upon ancillary revenue. The International Air Transport Association (IATA) predicts net profits of $29.3 billion for the world’s airline industry, which is dwarfed by ancillary revenue of $59.2 billion. IdeaWorksCompany estimates overall ancillary revenue activity will contribute $16.72 per passenger, while a la carte activity alone represents a very meaningful $10.36 per passenger.
These amounts easily cover IATA’s global net profit estimate of $8.27 per passenger. The bulk of the industry’s profits are represented by the turnaround that has occurred for US airlines. Profit margins for North America are projected to be 7.5%, while those outside North America are far lower at 3.1% or less.
Only within the last year did the industry finally deliver positive returns on invested capital… which IATA indicates is a first-ever event for the industry.
“The biggest news for 2015 is the rapid acceptance of ancillary revenue within Europe as a tool for network airlines,” says Jay Sorensen, President, IdeaWorksCompany. “Major players, such as Lufthansa, SWISS, and Austrian, have embraced a particular method called branded fares. This allows airlines to present distinct product options to consumers. In effect they can choose a fare that meets their needs, such as seat-only without a checked bag, or a fare packed with all kinds of extras. Look for this retail style to be adopted by airlines all over the world, which should boost ancillary revenue even higher for 2016.”

Tatiana is the news coordinator for TravelDailyNews Media Network (traveldailynews.gr, traveldailynews.com and traveldailynews.asia). Her role includes monitoring the hundreds of news sources of TravelDailyNews Media Network and skimming the most important according to our strategy.
She holds a Bachelor's degree in Communication & Mass Media from Panteion University of Political & Social Studies of Athens and she has been editor and editor-in-chief in various economic magazines and newspapers.