


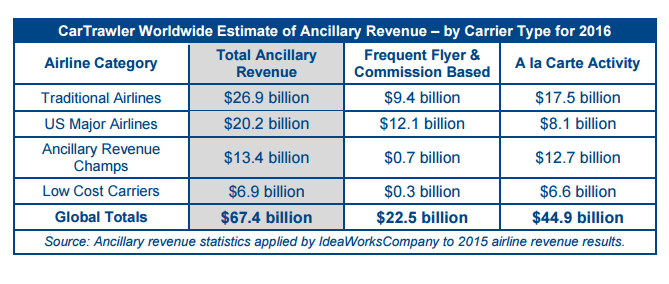
The CarTrawler global estimate forecasts 13.8% increase above 2015, with $44.9 billion of the total composed of a la carte fee activity.
DUBLIN, IRELAND & SHOREWOOD, WISCONSIN – IdeaWorksCompany, the foremost consultancy on airline ancillary revenues, and CarTrawler, leading provider of online car rental distribution systems, project airline ancillary revenue will reach $67.4 billion worldwide in 2016. The CarTrawler Worldwide Estimate of Ancillary Revenue represents a nearly 200% increase from the 2010 figure of $22.6 billion, which was the first year for the ancillary revenue estimate.
Earlier this year, CarTrawler and IdeaWorksCompany reported the ancillary revenue disclosed by 67 airlines for 2015. These statistics were applied to a larger list of 178 airlines to provide a truly global projection of ancillary revenue activity by the world’s airlines in 2016. The CarTrawler Worldwide Estimate of Ancillary Revenue marks the seventh year IdeaWorksCompany has prepared a projection of ancillary revenue activity.
Ancillary revenue is generated by activities and services that yield revenue for airlines beyond the simple transportation of customers from A to B. This wide range of activities includes: commissions gained from hotel bookings, the sale of frequent flyer miles to partners, and the provision of a la carte services ? providing more options for consumers and more profit for airlines.
 “Successful ancillary revenue generation is dependent on offering customers the right product at the right time, often before they have even asked for it. Amazon has proven to great effect the positive impact that data science has on its business, with an estimated one third of total sales now coming via their recommendation algorithm. As with Amazon, the unlocking of data-driven insights is enabling airlines to propose ancillary products and services to their customers in an increasingly sophisticated way. This application of data is fueling the continued growth of the sector while at the same time unearthing further potential for building loyalty by identifying when, how, where and what to offer customers when they visit your website or app”, said Aileen O’Mahony, Chief Commercial Officer at CarTrawler.
Revenue from optional services, such as onboard sales of food and beverages, checked baggage, premium seat assignments, and early boarding benefits, was determined to represent $44.9 billion of the projected global 2016 total. The smaller share, at $22.5 billion, comes from non-fee activity such as the sale of frequent flyer miles to program partners, and commissions earned on the sale of ground-based services to travelers, such as hotel accommodations and car rentals.
Analysis performed by IdeaWorksCompany during the past seven years reveals natural airline groupings (or categories) based upon a carrier’s ability to generate ancillary revenue. The “percentage of revenue” results associated with four defined categories have been applied to a worldwide compilation of operating revenue disclosed by 178 airlines.1 The following describes the four categories:
- Traditional Airlines. This category represents a catch-all for the largest number of carriers. Ancillary revenue activity may consist of fees associated with excess or heavy bags, extra legroom seating and partner activity for a frequent flyer program. The average percentage of revenue increased significantly to 5.8% from 4.1% last year. Examples in this category include Aerolineas Argentinas, Air New Zealand, LOT Polish Airlines, and Royal Jordanian.
- Major US Airlines. US-based majors generate strong ancillary revenue through a combination of frequent flyer revenue and baggage fees. The percentage of revenue for this group jumped to 12.3% for 2016 from 11.3% due to more bundled fare offers and improved frequent flyer revenue. Examples include Alaska, Delta, and United.
- Ancillary Revenue Champs. These carriers generate the highest activity as a percentage of operating revenue. The percentage of revenue achieved by this group dropped slightly to 25.5% from 26.1% for 2015. The decrease can be attributed to lower Ryanair ancillary revenue results which have a sizeable impact on the average for this category. Carrier examples include Allegiant, Eurowings, Flydubai, Hong Kong Express, and Ryanair.
- Low Cost Carriers. LCCs throughout the world typically rely upon a mix of a la carte activity to generate good levels of ancillary revenue. The percentage of revenue for this group remained unchanged for 2016 at 11.8%. Low cost carriers include AnadoluJet, Cebu Pacific Air, and VivaAerobus.
 Ancillary revenue for traditional airlines will jump for 2016
Traditional airlines, which includes global network carriers outside the US, achieved a $6.9 billion ancillary revenue leap for 2016. This is due to increased activity in the areas of branded fares, checked baggage, premium seating, and seat assignment. In particular, new a la carte options have become prevalent among Europe’s largest airlines. Baggage fees are nearly universal for travel within Europe. Branded fares, which link amenities to the choice or two or three fares, are now offered by Austrian, Lufthansa, and SWISS. Seat assignment fees for extra leg room seats on traditional airlines have become standard, with a growing number of carriers charging for any seat assigned before check-in. These changes have also been occurring all over the world. Even Emirates – a carrier hardly associated with ancillary revenue – implemented a seat assignment fee for its lowest priced fares. The change was effective 03 October 2016 and applies for seat assignments requested before check-in begins.
The fee varies by distance with $15 assessed for short-haul flights from Dubai and $40 for long-haul destinations such as the US and Australia. Ancillary revenue now has support from the top. Tim Clark, President of Emirates, said at a London conference in September 2016, “We simply have to increase our ancillary revenue streams.” His words reflect a thirst for ancillary revenue by airline executives all over the world. The graph below represents the likely distribution of ancillary revenue for traditional airlines outside the US. Admittedly, it’s difficult to create a pie graph to display the wide variation for traditional airlines throughout the world, such as an Air France in Europe or a Korean Air in Asia. In addition, the distribution of revenue sources is different for US airlines; these have a far larger slice served by the sale of frequent flyer miles. Meanwhile, a depiction of revenue sources for almost any low cost carrier would have the FFP component almost disappear; very few have frequent flyer programs that generate robust partner revenue. Global challenges influence the 2016 ancillary revenue estimate
IATA predicts global spending on air transport will drop this year to $740 billion. That’s a meaningful decrease from the $763 billion figure used to create the 2015 estimate. IdeaWorksCompany uses airline revenue as the basis for making these projections. Accordingly, the 2016 result suffered from the drop in consumer spending. Also contributing is the small ancillary revenue decrease (as a percent of total revenue) posted by Ryanair from 2014 to 2015 (24.6% to 24%). Ryanair, due to its big size, has a major impact on the calculations associated with the “Ancillary Revenue Champs” category.
EasyJet is another major player that once had significant influence on ancillary revenue estimates. The airline last fully disclosed its ancillary revenue back in 2011. Since then, IdeaWorksCompany provides an annual estimate to fill EasyJet’s very large revenue slot. Ending the practice of disclosure may have been caused by the carrier wishing to avoid the slings and arrows of the UK media which often accompanies ancillary revenue coverage. But another possibility exists, in which the carrier’s ancillary revenue efforts simply don’t measure up to Ryanair or other ancillary revenue champs.
Investors have become acutely aware of the necessity for ancillary revenue in the challenging world of airline economics. This is why Lufthansa Group presented its case as being proficient in the art of a la carte earlier this year with a 42-page briefing for its new Eurowings initiative. In its “Expert Session” presentation Lufthansa details how it encourages 45% of consumers to willingly pay a premium for its Smart and Best branded fares. The company eagerly details how Eurowings’ assigned seats and premium seating strategy delivers extra revenue of 19 euros per passenger on longhaul routes. Lufthansa Group clearly has embraced the ancillary revenue revolution.
On a global basis, ancillary revenue is estimated to represent 9.1% of airline revenue for 2016. That’s nearly double the 4.8% rate from 2010. But the most revealing statistic is the average per passenger bonus of $17.81 based upon IATA’s projection of 3.78 billion passengers for 2016. An impressive $11.86 of this per passenger amount can be attributed to all the optional extras now offered by airlines to their passengers. That’s the economic miracle of ancillary revenue. It allows passengers who seek the absolute lowest price to buy the basic seat-only fare. And for a growing number of consumers, it allows the flexibility of paying extra for more comfort and convenience. For airlines it provides the level of profit necessary to keep investors happy and millions employed.


Tatiana is the news coordinator for TravelDailyNews Media Network (traveldailynews.gr, traveldailynews.com and traveldailynews.asia). Her role includes monitoring the hundreds of news sources of TravelDailyNews Media Network and skimming the most important according to our strategy.
She holds a Bachelor's degree in Communication & Mass Media from Panteion University of Political & Social Studies of Athens and she has been editor and editor-in-chief in various economic magazines and newspapers.