


Ancillary revenue results show widespread improvement in the 2022 edition of the CarTrawler Yearbook of Ancillary Revenue.
SHOREWOOD, WISCONSIN and DUBLIN, IRELAND – The 2022 edition of the CarTrawler Yearbook of Ancillary Revenue by IdeaWorksCompany, released today, describes the 2021 ancillary revenue activities and results for 75 airlines. The gradual waning of the pandemic during 2021 – with passenger traffic improving 27.8% above 2020 – lifted ancillary revenue results for all categories of airlines, all over the world.
Average ancillary revenue per passenger was $29.96 among 75 airlines disclosing results for 2021. This is an $8.42 increase from the 2019 pre-pandemic result of $21.54 per passenger, the last year that offers a relevant comparison. But the improvement didn’t stop there: When measured by “ancillary revenue as a % of airline revenue,” each of four airline categories showed better results for 2021:
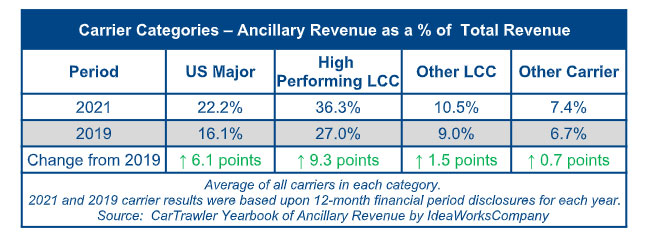
“It’s been no secret that the airline industry recovery has not been as smooth as we hoped following the pandemic, but it’s clear from the 2022 CarTrawler Yearbook of Ancillary Revenue that ancillary revenue has been a key driver of revenue for airlines in 2021,” says Aileen McCormack, Chief Commercial Officer, CarTrawler. “The report shows significant increases in ancillary revenue as a percentage of total revenue across all flight carriers – up to 35.5% for high-performing low-cost carriers and 22.2% for major US airlines, which is a very encouraging result for the industry. We are delighted to support our partners both in implementing technology to assist with ancillary revenue generation as well as through sponsoring this report to provide true insight into a key channel of revenue for the industry.”
The pandemic has compelled airlines to become better at generating ancillary revenue. The “High Performing LCC” category includes Frontier, Jet2.com, Jetstar, and Volaris. The “Other LCC” category (defined as having a rate under 16%) consists of carriers such as AirBaltic, Cebu Pacific, and FlyDubai. The “Other Carrier” category has the largest number of airlines, 32 out of the 75 in the yearbook, and includes traditional carriers such as Aeromexico, Finnair, and Kenya Airways. The US Majors are: Alaska Air Group, American, Delta, Southwest, and United.
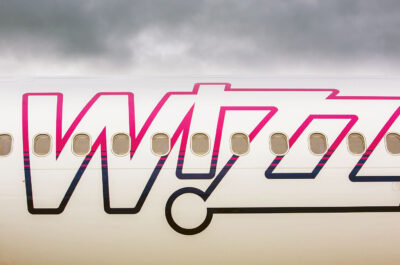
GOL had the greatest increase of 16 points among airlines appearing in the 2019 and 2021 yearbooks. The carrier’s ancillary revenue as a percent of total revenue was 33% for 2021 and 17% for 2019. Frontier had the second highest increase with an 11.3-point jump for 2021. Europe’s new king of ancillary revenue, Wizz Air, was third-ranked with a 10.6-point increase compared to 2019. The top 10 airlines, ranked by 2021 result, are listed in the table below:
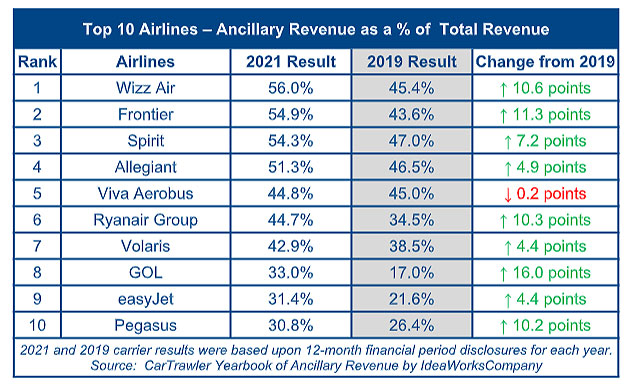
The fascinating element of the table is the almost universal positive results for 2021 compared to the pre-pandemic period of 2019. As a group, these high-performing airlines learned how to up their game in the following ways:
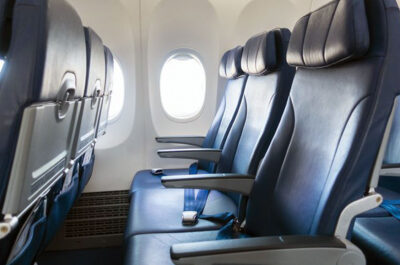
- Expanded their product offerings such as large carry-on fees, extra leg room zones, subscription-based benefits, freeze your price, and prepaid change flexibility.
- Adopted better retailing methods using mobile apps, websites, and online travel agencies to facilitate easier booking and more visibility.
- Responded to high demand with higher pricing as the industry moves through the pandemic recovery period.
- Applied revenue management techniques perfected for decades in the pricing of airfares.
Frequent flyer programs maintained their role as robust revenue sources as consumer spending began its rebound during the year. The co-branded credit cards associated with large programs – especially those in the US – generate revenue based upon everyday consumer spending. This preserves cashflow even when passenger traffic or fare revenue declines.
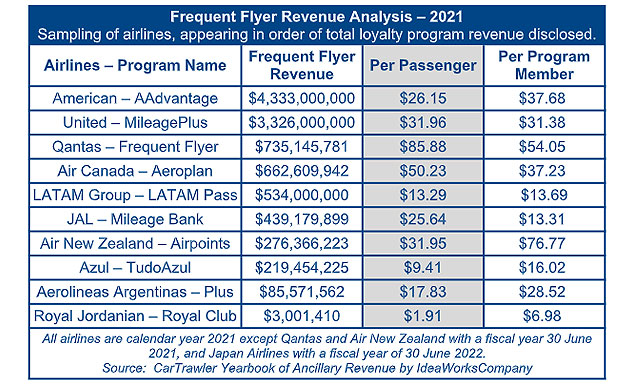
Attractive per passenger revenue is realized in markets which support consumer charge activity with card portfolios that command good prices for the miles or points sold to card-issuing banks. The five largest US airlines (Alaska, American, Delta, Southwest, and United) generated revenue of $16.4 billion from their frequent flyer programs in 2021. This yields an average of $30.88 per passenger, which is significantly above the 2019 rate of $25.71 per passenger for the five carriers. However, the $16.4 billion 5-carrier total for 2021 remains more than 15.7% below 2019. More than 90% of this cash bonanza is courtesy of co-branded credit card programs.
For the past two years, ancillary revenue has yielded amazing cashflow for airlines. Consumers benefit from a la carte products and the choice of minimum price or maximum convenience. The billions in revenue realized by the 75 airlines included in this yearbook may well represent the difference between a difficult survival or disappearance from the route map of the global airline industry.

Tatiana is the news coordinator for TravelDailyNews Media Network (traveldailynews.gr, traveldailynews.com and traveldailynews.asia). Her role includes monitoring the hundreds of news sources of TravelDailyNews Media Network and skimming the most important according to our strategy.
She holds a Bachelor's degree in Communication & Mass Media from Panteion University of Political & Social Studies of Athens and she has been editor and editor-in-chief in various economic magazines and newspapers.